Scandinavian vs Immigrants from Haiti 7th Grade
COMPARE
Scandinavian
Immigrants from Haiti
7th Grade
7th Grade Comparison
Scandinavians
Immigrants from Haiti
97.4%
7TH GRADE
100.0/ 100
METRIC RATING
29th/ 347
METRIC RANK
94.3%
7TH GRADE
0.0/ 100
METRIC RATING
304th/ 347
METRIC RANK
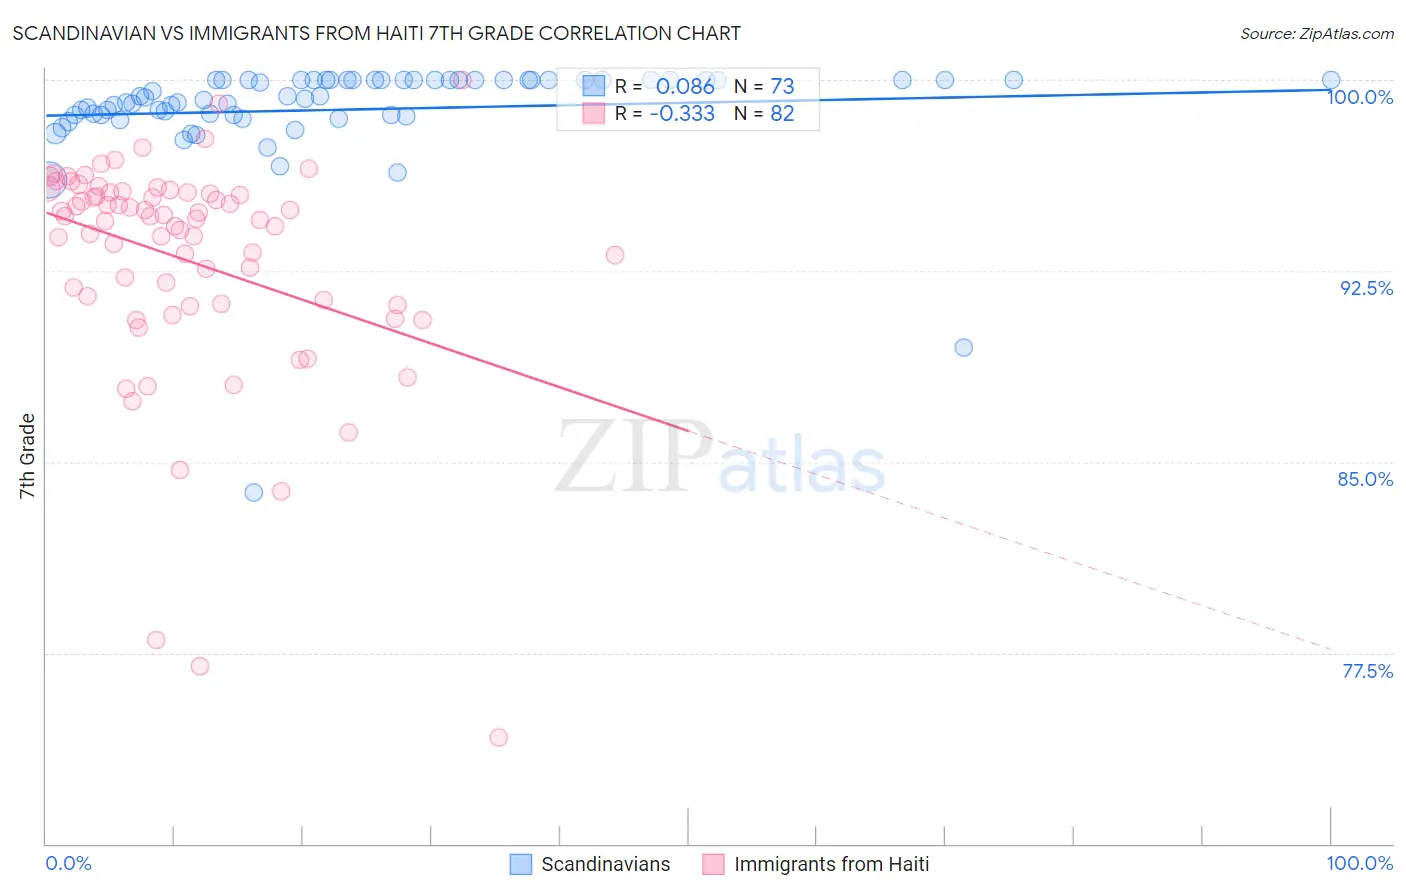
Scandinavian vs Immigrants from Haiti 7th Grade Correlation Chart
The statistical analysis conducted on geographies consisting of 472,660,435 people shows a slight positive correlation between the proportion of Scandinavians and percentage of population with at least 7th grade education in the United States with a correlation coefficient (R) of 0.086 and weighted average of 97.4%. Similarly, the statistical analysis conducted on geographies consisting of 225,287,083 people shows a mild negative correlation between the proportion of Immigrants from Haiti and percentage of population with at least 7th grade education in the United States with a correlation coefficient (R) of -0.333 and weighted average of 94.3%, a difference of 3.2%.
7th Grade Correlation Summary
| Measurement | Scandinavian | Immigrants from Haiti |
| Minimum | 83.8% | 74.2% |
| Maximum | 100.0% | 100.0% |
| Range | 16.2% | 25.8% |
| Mean | 98.8% | 92.9% |
| Median | 99.3% | 94.5% |
| Interquartile 25% (IQ1) | 98.6% | 91.2% |
| Interquartile 75% (IQ3) | 100.0% | 95.6% |
| Interquartile Range (IQR) | 1.4% | 4.4% |
| Standard Deviation (Sample) | 2.3% | 4.5% |
| Standard Deviation (Population) | 2.3% | 4.5% |
Similar Demographics by 7th Grade
Demographics Similar to Scandinavians by 7th Grade
In terms of 7th grade, the demographic groups most similar to Scandinavians are Sioux (97.4%, a difference of 0.0%), Czech (97.4%, a difference of 0.010%), French (97.4%, a difference of 0.030%), Scotch-Irish (97.4%, a difference of 0.030%), and Danish (97.4%, a difference of 0.030%).
| Demographics | Rating | Rank | 7th Grade |
| French Canadians | 100.0 /100 | #22 | Exceptional 97.4% |
| Croatians | 100.0 /100 | #23 | Exceptional 97.4% |
| Welsh | 100.0 /100 | #24 | Exceptional 97.4% |
| French | 100.0 /100 | #25 | Exceptional 97.4% |
| Scotch-Irish | 100.0 /100 | #26 | Exceptional 97.4% |
| Danes | 100.0 /100 | #27 | Exceptional 97.4% |
| Sioux | 100.0 /100 | #28 | Exceptional 97.4% |
| Scandinavians | 100.0 /100 | #29 | Exceptional 97.4% |
| Czechs | 100.0 /100 | #30 | Exceptional 97.4% |
| Europeans | 100.0 /100 | #31 | Exceptional 97.3% |
| Italians | 100.0 /100 | #32 | Exceptional 97.3% |
| Chippewa | 100.0 /100 | #33 | Exceptional 97.3% |
| Alaska Natives | 100.0 /100 | #34 | Exceptional 97.3% |
| Swiss | 100.0 /100 | #35 | Exceptional 97.3% |
| Hungarians | 100.0 /100 | #36 | Exceptional 97.2% |
Demographics Similar to Immigrants from Haiti by 7th Grade
In terms of 7th grade, the demographic groups most similar to Immigrants from Haiti are Guyanese (94.3%, a difference of 0.020%), Sri Lankan (94.4%, a difference of 0.030%), Immigrants from Dominica (94.5%, a difference of 0.12%), Immigrants from Laos (94.5%, a difference of 0.12%), and Immigrants from Burma/Myanmar (94.5%, a difference of 0.15%).
| Demographics | Rating | Rank | 7th Grade |
| Immigrants | South Eastern Asia | 0.0 /100 | #297 | Tragic 94.5% |
| Indonesians | 0.0 /100 | #298 | Tragic 94.5% |
| Bangladeshis | 0.0 /100 | #299 | Tragic 94.5% |
| Immigrants | Burma/Myanmar | 0.0 /100 | #300 | Tragic 94.5% |
| Immigrants | Dominica | 0.0 /100 | #301 | Tragic 94.5% |
| Immigrants | Laos | 0.0 /100 | #302 | Tragic 94.5% |
| Sri Lankans | 0.0 /100 | #303 | Tragic 94.4% |
| Immigrants | Haiti | 0.0 /100 | #304 | Tragic 94.3% |
| Guyanese | 0.0 /100 | #305 | Tragic 94.3% |
| Immigrants | Guyana | 0.0 /100 | #306 | Tragic 94.2% |
| Immigrants | Portugal | 0.0 /100 | #307 | Tragic 94.2% |
| Cape Verdeans | 0.0 /100 | #308 | Tragic 94.1% |
| Ecuadorians | 0.0 /100 | #309 | Tragic 94.0% |
| Immigrants | Caribbean | 0.0 /100 | #310 | Tragic 94.0% |
| Puerto Ricans | 0.0 /100 | #311 | Tragic 94.0% |