Scandinavian vs Immigrants from Kazakhstan 7th Grade

COMPARE

Scandinavian
Race
Ancestry
AfghanAfricanAlaska NativeAlaskan AthabascanAlbanianAleutAlsatianAmericanApacheArabArapahoArgentineanArmenianAssyrian/Chaldean/SyriacAustralianAustrianBahamianBangladeshiBarbadianBasqueBelgianBelizeanBermudanBhutaneseBlackfeetBolivianBrazilianBritishBritish West IndianBulgarianBurmeseCajunCambodianCanadianCape VerdeanCarpatho RusynCelticCentral AmericanCentral American IndianCherokeeCheyenneChickasawChileanChineseChippewaChoctawColombianColvilleComancheCosta RicanCreeCreekCroatianCrowCubanCypriotCzechCzechoslovakianDanishDelawareDominicanDutchDutch West IndianEastern EuropeanEcuadorianEgyptianEnglishEstonianEthiopianEuropeanFijianFilipinoFinnishFrenchFrench American IndianFrench CanadianGermanGerman RussianGhanaianGreekGuamanian/ChamorroGuatemalanGuyaneseHaitianHmongHonduranHopiHoumaHungarianIcelanderIndian (Asian)IndonesianInupiatIranianIraqiIrishIroquoisIsraeliItalianJamaicanJapaneseJordanianKenyanKiowaKoreanLaotianLatvianLebaneseLiberianLithuanianLumbeeLuxembourgerMacedonianMalaysianMalteseMarshalleseMenomineeMexicanMexican American IndianMongolianMoroccanNative HawaiianNavajoNepaleseNew ZealanderNicaraguanNigerianNorthern EuropeanNorwegianOkinawanOsageOttawaPaiutePakistaniPalestinianPanamanianParaguayanPennsylvania GermanPeruvianPimaPolishPortuguesePotawatomiPuebloPuerto RicanPuget Sound SalishRomanianRussianSalvadoranSamoanScandinavianScotch-IrishScottishSeminoleSenegaleseSerbianShoshoneSierra LeoneanSiouxSlavicSlovakSloveneSomaliSouth AfricanSouth AmericanSouth American IndianSoviet UnionSpaniardSpanishSpanish AmericanSpanish American IndianSri LankanSubsaharan AfricanSudaneseSwedishSwissSyrianTaiwaneseThaiTlingit-HaidaTohono O'OdhamTonganTrinidadian and TobagonianTsimshianTurkishU.S. Virgin IslanderUgandanUkrainianUruguayanUteVenezuelanVietnameseWelshWest IndianYakamaYaquiYugoslavianYumanYup'ikZimbabwean
Immigration
NonimmigrantsImmigrantsAfghanistanAfricaAlbaniaArgentinaArmeniaAsiaAustraliaAustriaBahamasBangladeshBarbadosBelarusBelgiumBelizeBoliviaBosnia and HerzegovinaBrazilBulgariaBurma/MyanmarCabo VerdeCambodiaCameroonCanadaCaribbeanCentral AmericaChileChinaColombiaCongoCosta RicaCroatiaCubaCzechoslovakiaDenmarkDominicaDominican RepublicEastern AfricaEastern AsiaEastern EuropeEcuadorEgyptEl SalvadorEnglandEritreaEthiopiaEuropeFijiFranceGermanyGhanaGreeceGrenadaGuatemalaGuyanaHaitiHondurasHong KongHungaryIndiaIndonesiaIranIraqIrelandIsraelItalyJamaicaJapanJordanKenyaKoreaKuwaitLaosLatin AmericaLatviaLebanonLiberiaLithuaniaMalaysiaMexicoMicronesiaMiddle AfricaMoldovaMoroccoNepalNetherlandsNicaraguaNigeriaNorth AmericaNorth MacedoniaNorthern AfricaNorthern EuropeNorwayOceaniaPakistanPanamaPeruPhilippinesPolandPortugalRomaniaRussiaSaudi ArabiaScotlandSenegalSerbiaSierra LeoneSingaporeSomaliaSouth AfricaSouth AmericaSouth Central AsiaSouth Eastern AsiaSouthern EuropeSpainSri LankaSt. Vincent and the GrenadinesSudanSwedenSwitzerlandSyriaTaiwanThailandTrinidad and TobagoTurkeyUgandaUkraineUruguayUzbekistanVenezuelaVietnamWest IndiesWestern AfricaWestern AsiaWestern EuropeYemenZaireZimbabweAzores
Immigrants from Kazakhstan
Race
Ancestry
AfghanAfricanAlaska NativeAlaskan AthabascanAlbanianAleutAlsatianAmericanApacheArabArapahoArgentineanArmenianAssyrian/Chaldean/SyriacAustralianAustrianBahamianBangladeshiBarbadianBasqueBelgianBelizeanBermudanBhutaneseBlackfeetBolivianBrazilianBritishBritish West IndianBulgarianBurmeseCajunCambodianCanadianCape VerdeanCarpatho RusynCelticCentral AmericanCentral American IndianCherokeeCheyenneChickasawChileanChineseChippewaChoctawColombianColvilleComancheCosta RicanCreeCreekCroatianCrowCubanCypriotCzechCzechoslovakianDanishDelawareDominicanDutchDutch West IndianEastern EuropeanEcuadorianEgyptianEnglishEstonianEthiopianEuropeanFijianFilipinoFinnishFrenchFrench American IndianFrench CanadianGermanGerman RussianGhanaianGreekGuamanian/ChamorroGuatemalanGuyaneseHaitianHmongHonduranHopiHoumaHungarianIcelanderIndian (Asian)IndonesianInupiatIranianIraqiIrishIroquoisIsraeliItalianJamaicanJapaneseJordanianKenyanKiowaKoreanLaotianLatvianLebaneseLiberianLithuanianLumbeeLuxembourgerMacedonianMalaysianMalteseMarshalleseMenomineeMexicanMexican American IndianMongolianMoroccanNative HawaiianNavajoNepaleseNew ZealanderNicaraguanNigerianNorthern EuropeanNorwegianOkinawanOsageOttawaPaiutePakistaniPalestinianPanamanianParaguayanPennsylvania GermanPeruvianPimaPolishPortuguesePotawatomiPuebloPuerto RicanPuget Sound SalishRomanianRussianSalvadoranSamoanScotch-IrishScottishSeminoleSenegaleseSerbianShoshoneSierra LeoneanSiouxSlavicSlovakSloveneSomaliSouth AfricanSouth AmericanSouth American IndianSoviet UnionSpaniardSpanishSpanish AmericanSpanish American IndianSri LankanSubsaharan AfricanSudaneseSwedishSwissSyrianTaiwaneseThaiTlingit-HaidaTohono O'OdhamTonganTrinidadian and TobagonianTsimshianTurkishU.S. Virgin IslanderUgandanUkrainianUruguayanUteVenezuelanVietnameseWelshWest IndianYakamaYaquiYugoslavianYumanYup'ikZimbabwean
Immigration
NonimmigrantsImmigrantsAfghanistanAfricaAlbaniaArgentinaArmeniaAsiaAustraliaAustriaBahamasBangladeshBarbadosBelarusBelgiumBelizeBoliviaBosnia and HerzegovinaBrazilBulgariaBurma/MyanmarCabo VerdeCambodiaCameroonCanadaCaribbeanCentral AmericaChileChinaColombiaCongoCosta RicaCroatiaCubaCzechoslovakiaDenmarkDominicaDominican RepublicEastern AfricaEastern AsiaEastern EuropeEcuadorEgyptEl SalvadorEnglandEritreaEthiopiaEuropeFijiFranceGermanyGhanaGreeceGrenadaGuatemalaGuyanaHaitiHondurasHong KongHungaryIndiaIndonesiaIranIraqIrelandIsraelItalyJamaicaJapanJordanKazakhstanKenyaKoreaKuwaitLaosLatin AmericaLatviaLebanonLiberiaLithuaniaMalaysiaMexicoMicronesiaMiddle AfricaMoldovaMoroccoNepalNetherlandsNicaraguaNigeriaNorth AmericaNorth MacedoniaNorthern AfricaNorthern EuropeNorwayOceaniaPakistanPanamaPeruPhilippinesPolandPortugalRomaniaRussiaSaudi ArabiaScotlandSenegalSerbiaSierra LeoneSingaporeSomaliaSouth AfricaSouth AmericaSouth Central AsiaSouth Eastern AsiaSouthern EuropeSpainSri LankaSt. Vincent and the GrenadinesSudanSwedenSwitzerlandSyriaTaiwanThailandTrinidad and TobagoTurkeyUgandaUkraineUruguayUzbekistanVenezuelaVietnamWest IndiesWestern AfricaWestern AsiaWestern EuropeYemenZaireZimbabweAzores
7th Grade
Income
Poverty
Unemployment
Labor Participation
Family Structure
Vehicle Availability
Education Level
Disability

7th Grade Comparison

Scandinavians

Immigrants from Kazakhstan

Exceptional
Good
97.4%
7TH GRADE
100.0/ 100
METRIC RATING
29th/ 347
METRIC RANK
96.1%
7TH GRADE
61.0/ 100
METRIC RATING
166th/ 347
METRIC RANK

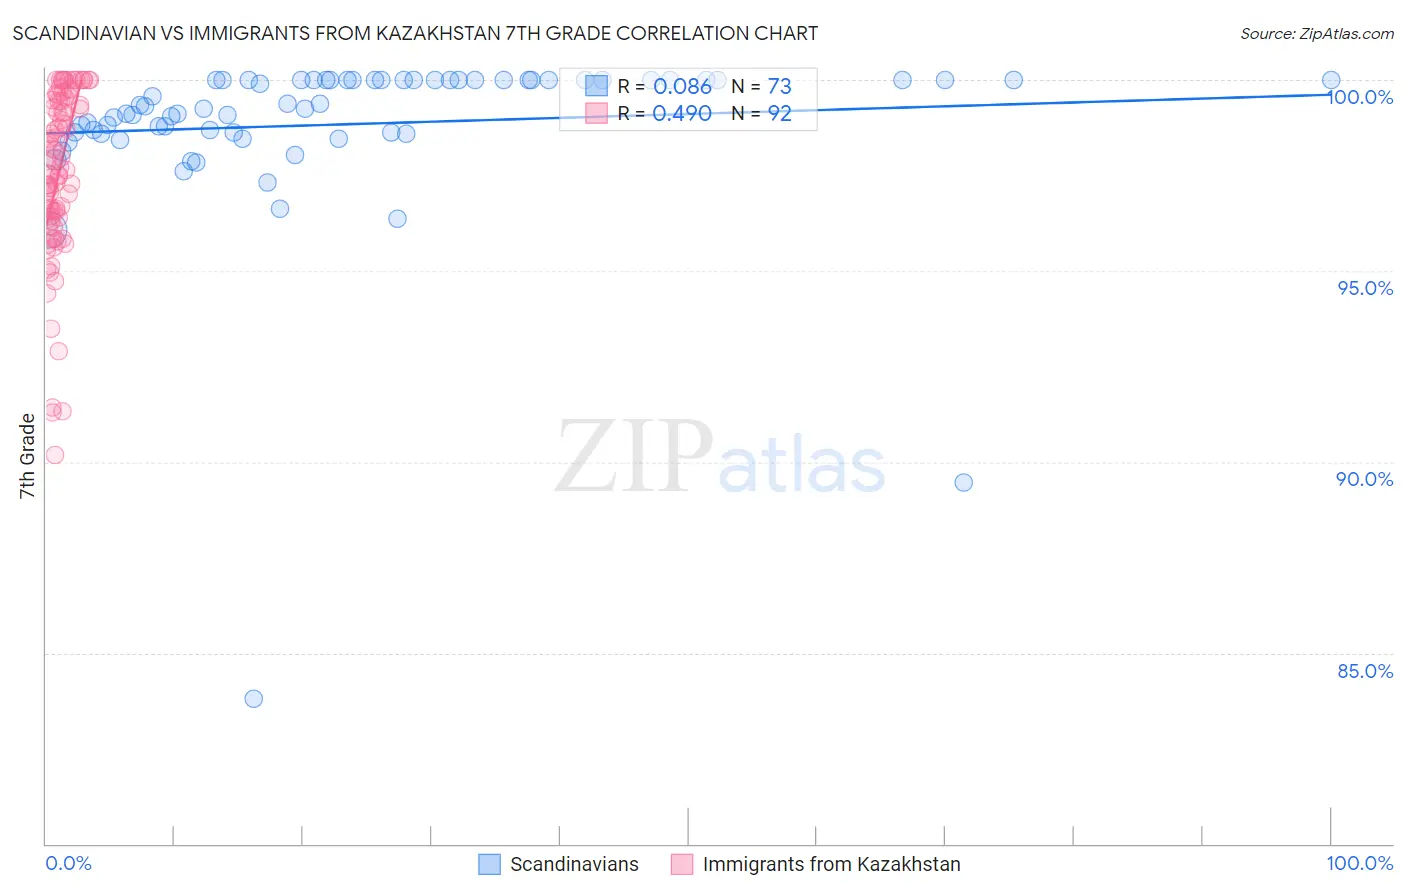
Scandinavian vs Immigrants from Kazakhstan 7th Grade Correlation Chart

The statistical analysis conducted on geographies consisting of 472,660,435 people shows a slight positive correlation between the proportion of Scandinavians and percentage of population with at least 7th grade education in the United States with a correlation coefficient (R) of 0.086 and weighted average of 97.4%. Similarly, the statistical analysis conducted on geographies consisting of 124,430,097 people shows a moderate positive correlation between the proportion of Immigrants from Kazakhstan and percentage of population with at least 7th grade education in the United States with a correlation coefficient (R) of 0.490 and weighted average of 96.1%, a difference of 1.3%.
Scandinavian vs Immigrants from Kazakhstan 7th Grade

7th Grade Correlation Summary

MeasurementScandinavianImmigrants from Kazakhstan
Minimum83.8%90.2%
Maximum100.0%100.0%
Range16.2%9.8%
Mean98.8%97.5%
Median99.3%97.7%
Interquartile 25% (IQ1)98.6%96.4%
Interquartile 75% (IQ3)100.0%99.5%
Interquartile Range (IQR)1.4%3.1%
Standard Deviation (Sample)2.3%2.2%
Standard Deviation (Population)2.3%2.2%

Similar Demographics by 7th Grade

Demographics Similar to Scandinavians by 7th Grade

In terms of 7th grade, the demographic groups most similar to Scandinavians are Sioux (97.4%, a difference of 0.0%), Czech (97.4%, a difference of 0.010%), French (97.4%, a difference of 0.030%), Scotch-Irish (97.4%, a difference of 0.030%), and Danish (97.4%, a difference of 0.030%).
DemographicsRating | Rank7th Grade
French Canadians
100.0
/100
|
#22
Exceptional
97.4%
Croatians
100.0
/100
|
#23
Exceptional
97.4%
Welsh
100.0
/100
|
#24
Exceptional
97.4%
French
100.0
/100
|
#25
Exceptional
97.4%
Scotch-Irish
100.0
/100
|
#26
Exceptional
97.4%
Danes
100.0
/100
|
#27
Exceptional
97.4%
Sioux
100.0
/100
|
#28
Exceptional
97.4%
Scandinavians
100.0
/100
|
#29
Exceptional
97.4%
Czechs
100.0
/100
|
#30
Exceptional
97.4%
Europeans
100.0
/100
|
#31
Exceptional
97.3%
Italians
100.0
/100
|
#32
Exceptional
97.3%
Chippewa
100.0
/100
|
#33
Exceptional
97.3%
Alaska Natives
100.0
/100
|
#34
Exceptional
97.3%
Swiss
100.0
/100
|
#35
Exceptional
97.3%
Hungarians
100.0
/100
|
#36
Exceptional
97.2%

Demographics Similar to Immigrants from Kazakhstan by 7th Grade

In terms of 7th grade, the demographic groups most similar to Immigrants from Kazakhstan are Immigrants from Taiwan (96.1%, a difference of 0.0%), Spaniard (96.1%, a difference of 0.010%), Immigrants from Italy (96.1%, a difference of 0.010%), Immigrants from Sri Lanka (96.1%, a difference of 0.010%), and Immigrants from Poland (96.1%, a difference of 0.010%).
DemographicsRating | Rank7th Grade
Alsatians
67.2
/100
|
#159
Good
96.1%
Immigrants | Kenya
66.8
/100
|
#160
Good
96.1%
Bermudans
66.3
/100
|
#161
Good
96.1%
Pima
64.3
/100
|
#162
Good
96.1%
Spaniards
62.6
/100
|
#163
Good
96.1%
Immigrants | Italy
62.1
/100
|
#164
Good
96.1%
Immigrants | Taiwan
61.5
/100
|
#165
Good
96.1%
Immigrants | Kazakhstan
61.0
/100
|
#166
Good
96.1%
Immigrants | Sri Lanka
59.9
/100
|
#167
Average
96.1%
Immigrants | Poland
59.0
/100
|
#168
Average
96.1%
Ute
55.8
/100
|
#169
Average
96.1%
Immigrants | Ukraine
55.0
/100
|
#170
Average
96.1%
Egyptians
54.2
/100
|
#171
Average
96.1%
Venezuelans
51.4
/100
|
#172
Average
96.0%
Immigrants | Albania
50.4
/100
|
#173
Average
96.0%