Immigrants from Armenia vs Assyrian/Chaldean/Syriac No Schooling Completed
COMPARE
Immigrants from Armenia
Assyrian/Chaldean/Syriac
No Schooling Completed
No Schooling Completed Comparison
Immigrants from Armenia
Assyrians/Chaldeans/Syriacs
3.3%
NO SCHOOLING COMPLETED
0.0/ 100
METRIC RATING
330th/ 347
METRIC RANK
2.5%
NO SCHOOLING COMPLETED
0.6/ 100
METRIC RATING
258th/ 347
METRIC RANK
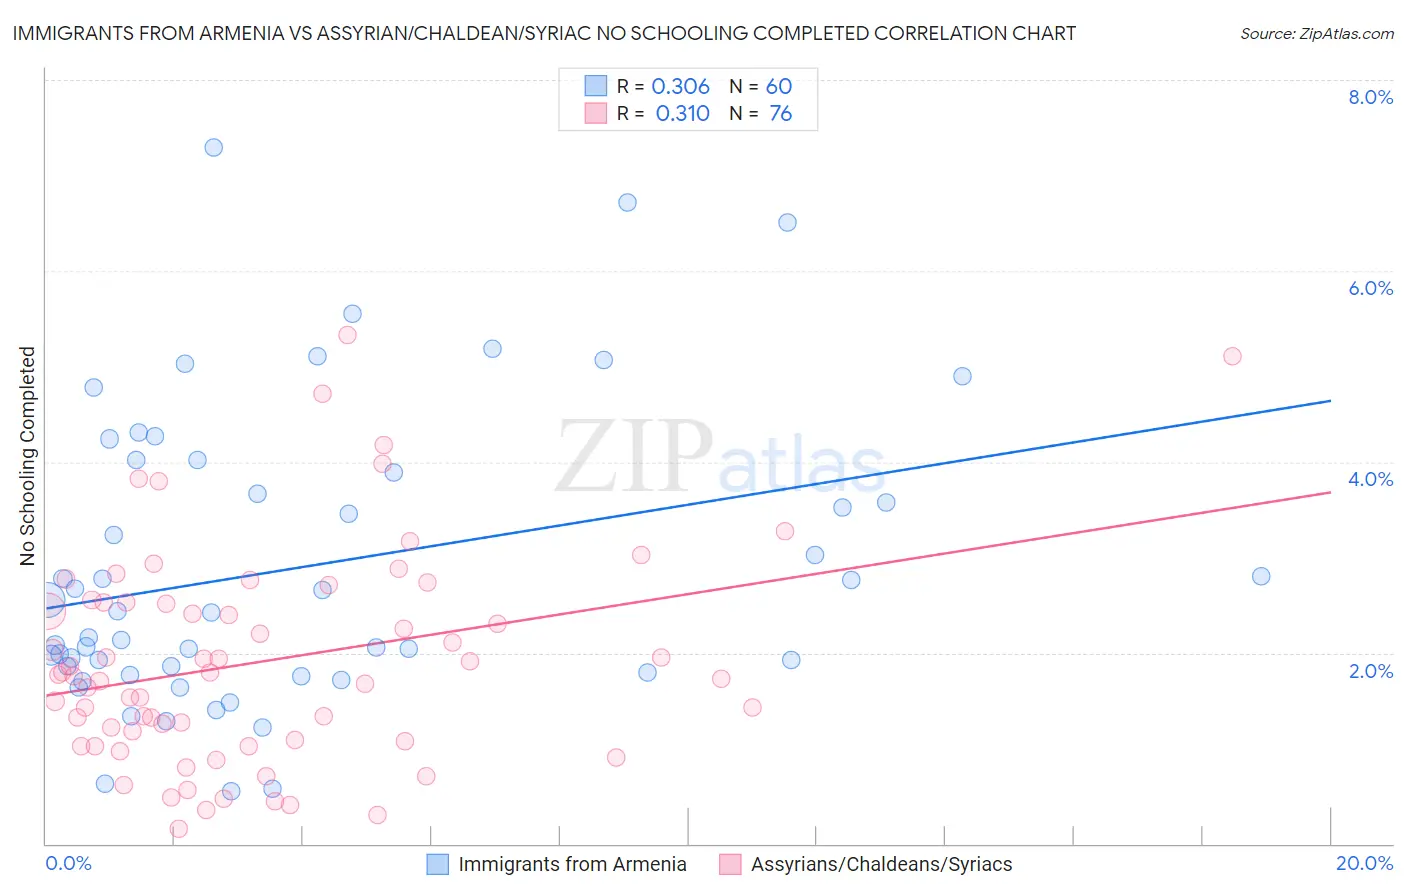
Immigrants from Armenia vs Assyrian/Chaldean/Syriac No Schooling Completed Correlation Chart
The statistical analysis conducted on geographies consisting of 97,592,780 people shows a mild positive correlation between the proportion of Immigrants from Armenia and percentage of population with no schooling in the United States with a correlation coefficient (R) of 0.306 and weighted average of 3.3%. Similarly, the statistical analysis conducted on geographies consisting of 110,066,308 people shows a mild positive correlation between the proportion of Assyrians/Chaldeans/Syriacs and percentage of population with no schooling in the United States with a correlation coefficient (R) of 0.310 and weighted average of 2.5%, a difference of 36.4%.
No Schooling Completed Correlation Summary
| Measurement | Immigrants from Armenia | Assyrian/Chaldean/Syriac |
| Minimum | 0.55% | 0.15% |
| Maximum | 7.3% | 5.3% |
| Range | 6.7% | 5.2% |
| Mean | 2.9% | 1.9% |
| Median | 2.4% | 1.8% |
| Interquartile 25% (IQ1) | 1.8% | 1.1% |
| Interquartile 75% (IQ3) | 4.0% | 2.5% |
| Interquartile Range (IQR) | 2.1% | 1.4% |
| Standard Deviation (Sample) | 1.6% | 1.1% |
| Standard Deviation (Population) | 1.5% | 1.1% |
Similar Demographics by No Schooling Completed
Demographics Similar to Immigrants from Armenia by No Schooling Completed
In terms of no schooling completed, the demographic groups most similar to Immigrants from Armenia are Japanese (3.3%, a difference of 0.030%), Immigrants from Vietnam (3.3%, a difference of 0.42%), Mexican (3.3%, a difference of 1.5%), Central American (3.4%, a difference of 1.5%), and Immigrants from Dominican Republic (3.4%, a difference of 1.6%).
| Demographics | Rating | Rank | No Schooling Completed |
| Vietnamese | 0.0 /100 | #323 | Tragic 3.2% |
| Mexican American Indians | 0.0 /100 | #324 | Tragic 3.2% |
| Dominicans | 0.0 /100 | #325 | Tragic 3.2% |
| Indonesians | 0.0 /100 | #326 | Tragic 3.2% |
| Immigrants | Latin America | 0.0 /100 | #327 | Tragic 3.3% |
| Mexicans | 0.0 /100 | #328 | Tragic 3.3% |
| Immigrants | Vietnam | 0.0 /100 | #329 | Tragic 3.3% |
| Immigrants | Armenia | 0.0 /100 | #330 | Tragic 3.3% |
| Japanese | 0.0 /100 | #331 | Tragic 3.3% |
| Central Americans | 0.0 /100 | #332 | Tragic 3.4% |
| Immigrants | Dominican Republic | 0.0 /100 | #333 | Tragic 3.4% |
| Guatemalans | 0.0 /100 | #334 | Tragic 3.5% |
| Immigrants | Cambodia | 0.0 /100 | #335 | Tragic 3.5% |
| Immigrants | Fiji | 0.0 /100 | #336 | Tragic 3.5% |
| Immigrants | Cabo Verde | 0.0 /100 | #337 | Tragic 3.5% |
Demographics Similar to Assyrians/Chaldeans/Syriacs by No Schooling Completed
In terms of no schooling completed, the demographic groups most similar to Assyrians/Chaldeans/Syriacs are Immigrants from South America (2.5%, a difference of 0.030%), Immigrants from Jamaica (2.5%, a difference of 0.060%), Immigrants from Ethiopia (2.5%, a difference of 0.11%), Armenian (2.5%, a difference of 0.23%), and Immigrants from Sierra Leone (2.5%, a difference of 0.58%).
| Demographics | Rating | Rank | No Schooling Completed |
| Immigrants | Africa | 1.1 /100 | #251 | Tragic 2.4% |
| Immigrants | Colombia | 1.0 /100 | #252 | Tragic 2.4% |
| Immigrants | Asia | 0.9 /100 | #253 | Tragic 2.4% |
| Immigrants | Eastern Africa | 0.9 /100 | #254 | Tragic 2.4% |
| Ethiopians | 0.8 /100 | #255 | Tragic 2.4% |
| Yaqui | 0.8 /100 | #256 | Tragic 2.4% |
| Immigrants | South America | 0.6 /100 | #257 | Tragic 2.5% |
| Assyrians/Chaldeans/Syriacs | 0.6 /100 | #258 | Tragic 2.5% |
| Immigrants | Jamaica | 0.6 /100 | #259 | Tragic 2.5% |
| Immigrants | Ethiopia | 0.6 /100 | #260 | Tragic 2.5% |
| Armenians | 0.5 /100 | #261 | Tragic 2.5% |
| Immigrants | Sierra Leone | 0.5 /100 | #262 | Tragic 2.5% |
| Immigrants | Liberia | 0.4 /100 | #263 | Tragic 2.5% |
| Indians (Asian) | 0.4 /100 | #264 | Tragic 2.5% |
| West Indians | 0.4 /100 | #265 | Tragic 2.5% |