Cypriot vs Trinidadian and Tobagonian 4th Grade
COMPARE
Cypriot
Trinidadian and Tobagonian
4th Grade
4th Grade Comparison
Cypriots
Trinidadians and Tobagonians
97.9%
4TH GRADE
98.9/ 100
METRIC RATING
84th/ 347
METRIC RANK
96.9%
4TH GRADE
0.1/ 100
METRIC RATING
274th/ 347
METRIC RANK
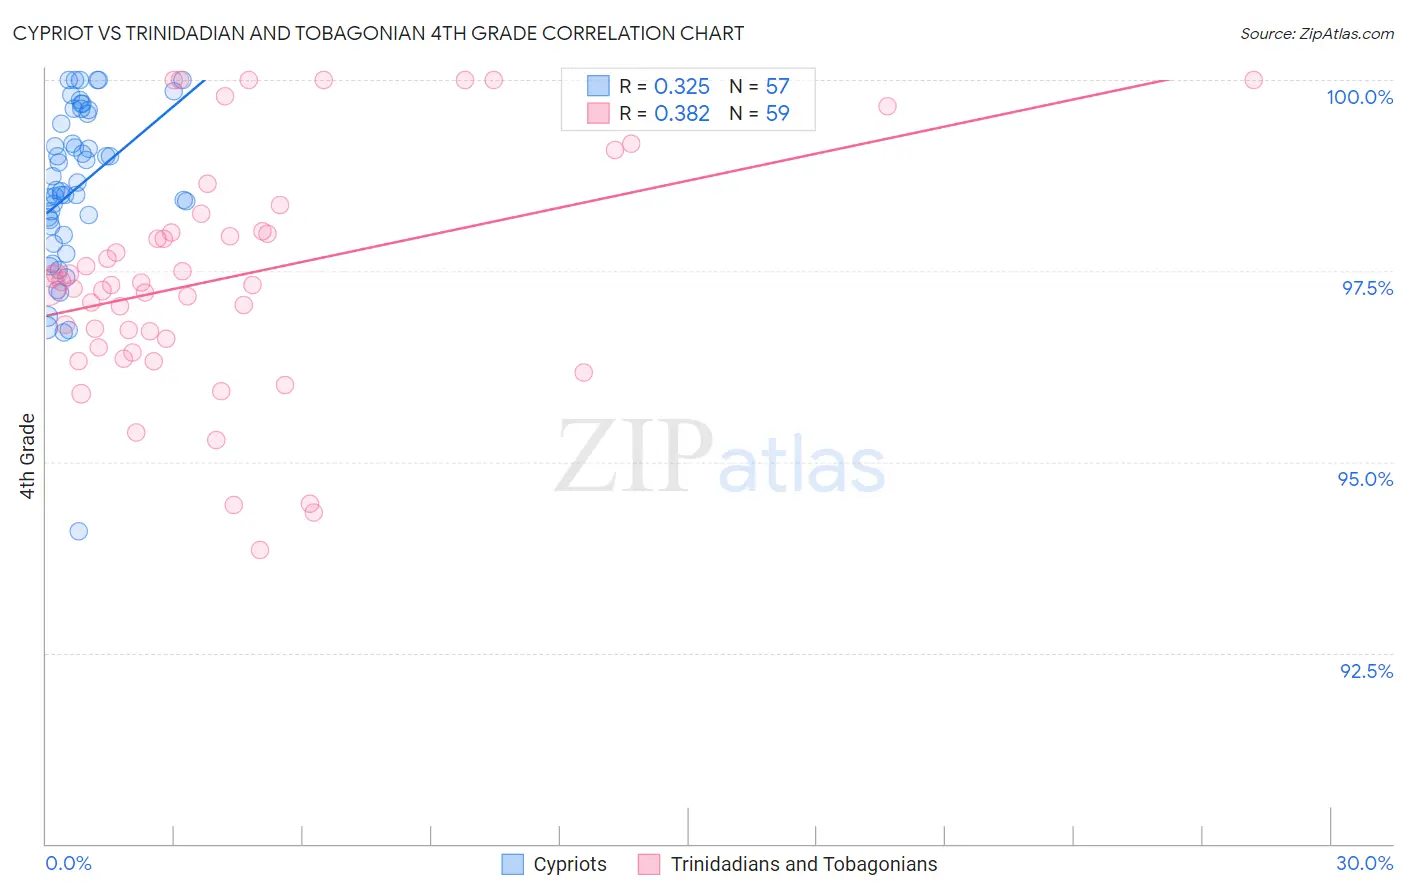
Cypriot vs Trinidadian and Tobagonian 4th Grade Correlation Chart
The statistical analysis conducted on geographies consisting of 61,870,289 people shows a mild positive correlation between the proportion of Cypriots and percentage of population with at least 4th grade education in the United States with a correlation coefficient (R) of 0.325 and weighted average of 97.9%. Similarly, the statistical analysis conducted on geographies consisting of 219,882,819 people shows a mild positive correlation between the proportion of Trinidadians and Tobagonians and percentage of population with at least 4th grade education in the United States with a correlation coefficient (R) of 0.382 and weighted average of 96.9%, a difference of 1.1%.
4th Grade Correlation Summary
| Measurement | Cypriot | Trinidadian and Tobagonian |
| Minimum | 94.1% | 93.8% |
| Maximum | 100.0% | 100.0% |
| Range | 5.9% | 6.2% |
| Mean | 98.6% | 97.4% |
| Median | 98.6% | 97.3% |
| Interquartile 25% (IQ1) | 98.0% | 96.5% |
| Interquartile 75% (IQ3) | 99.6% | 98.0% |
| Interquartile Range (IQR) | 1.6% | 1.5% |
| Standard Deviation (Sample) | 1.1% | 1.5% |
| Standard Deviation (Population) | 1.1% | 1.5% |
Similar Demographics by 4th Grade
Demographics Similar to Cypriots by 4th Grade
In terms of 4th grade, the demographic groups most similar to Cypriots are Potawatomi (97.9%, a difference of 0.0%), Immigrants from Australia (97.9%, a difference of 0.0%), Immigrants from Belgium (97.9%, a difference of 0.010%), Zimbabwean (97.9%, a difference of 0.010%), and Immigrants from South Africa (97.9%, a difference of 0.010%).
| Demographics | Rating | Rank | 4th Grade |
| Immigrants | Lithuania | 99.3 /100 | #77 | Exceptional 98.0% |
| Immigrants | England | 99.3 /100 | #78 | Exceptional 98.0% |
| Ukrainians | 99.2 /100 | #79 | Exceptional 98.0% |
| Osage | 99.2 /100 | #80 | Exceptional 98.0% |
| Immigrants | India | 99.1 /100 | #81 | Exceptional 98.0% |
| Icelanders | 99.1 /100 | #82 | Exceptional 98.0% |
| Immigrants | Belgium | 99.0 /100 | #83 | Exceptional 97.9% |
| Cypriots | 98.9 /100 | #84 | Exceptional 97.9% |
| Potawatomi | 98.9 /100 | #85 | Exceptional 97.9% |
| Immigrants | Australia | 98.8 /100 | #86 | Exceptional 97.9% |
| Zimbabweans | 98.8 /100 | #87 | Exceptional 97.9% |
| Immigrants | South Africa | 98.8 /100 | #88 | Exceptional 97.9% |
| Delaware | 98.8 /100 | #89 | Exceptional 97.9% |
| Immigrants | Denmark | 98.7 /100 | #90 | Exceptional 97.9% |
| Immigrants | Sweden | 98.7 /100 | #91 | Exceptional 97.9% |
Demographics Similar to Trinidadians and Tobagonians by 4th Grade
In terms of 4th grade, the demographic groups most similar to Trinidadians and Tobagonians are Fijian (96.9%, a difference of 0.010%), Immigrants from Cameroon (96.9%, a difference of 0.010%), Immigrants from Ghana (96.9%, a difference of 0.010%), Yaqui (96.9%, a difference of 0.010%), and Immigrants from Western Africa (96.9%, a difference of 0.010%).
| Demographics | Rating | Rank | 4th Grade |
| Immigrants | Nigeria | 0.3 /100 | #267 | Tragic 97.0% |
| Ghanaians | 0.2 /100 | #268 | Tragic 97.0% |
| Immigrants | Uzbekistan | 0.2 /100 | #269 | Tragic 96.9% |
| Cubans | 0.2 /100 | #270 | Tragic 96.9% |
| Immigrants | Peru | 0.1 /100 | #271 | Tragic 96.9% |
| Fijians | 0.1 /100 | #272 | Tragic 96.9% |
| Immigrants | Cameroon | 0.1 /100 | #273 | Tragic 96.9% |
| Trinidadians and Tobagonians | 0.1 /100 | #274 | Tragic 96.9% |
| Immigrants | Ghana | 0.1 /100 | #275 | Tragic 96.9% |
| Yaqui | 0.1 /100 | #276 | Tragic 96.9% |
| Immigrants | Western Africa | 0.1 /100 | #277 | Tragic 96.9% |
| Immigrants | Bolivia | 0.1 /100 | #278 | Tragic 96.9% |
| Afghans | 0.1 /100 | #279 | Tragic 96.9% |
| Barbadians | 0.1 /100 | #280 | Tragic 96.9% |
| Immigrants | Hong Kong | 0.1 /100 | #281 | Tragic 96.9% |