Samoan vs Immigrants from South America 4th Grade
COMPARE
Samoan
Immigrants from South America
4th Grade
4th Grade Comparison
Samoans
Immigrants from South America
97.3%
4TH GRADE
6.8/ 100
METRIC RATING
216th/ 347
METRIC RANK
97.0%
4TH GRADE
0.4/ 100
METRIC RATING
261st/ 347
METRIC RANK
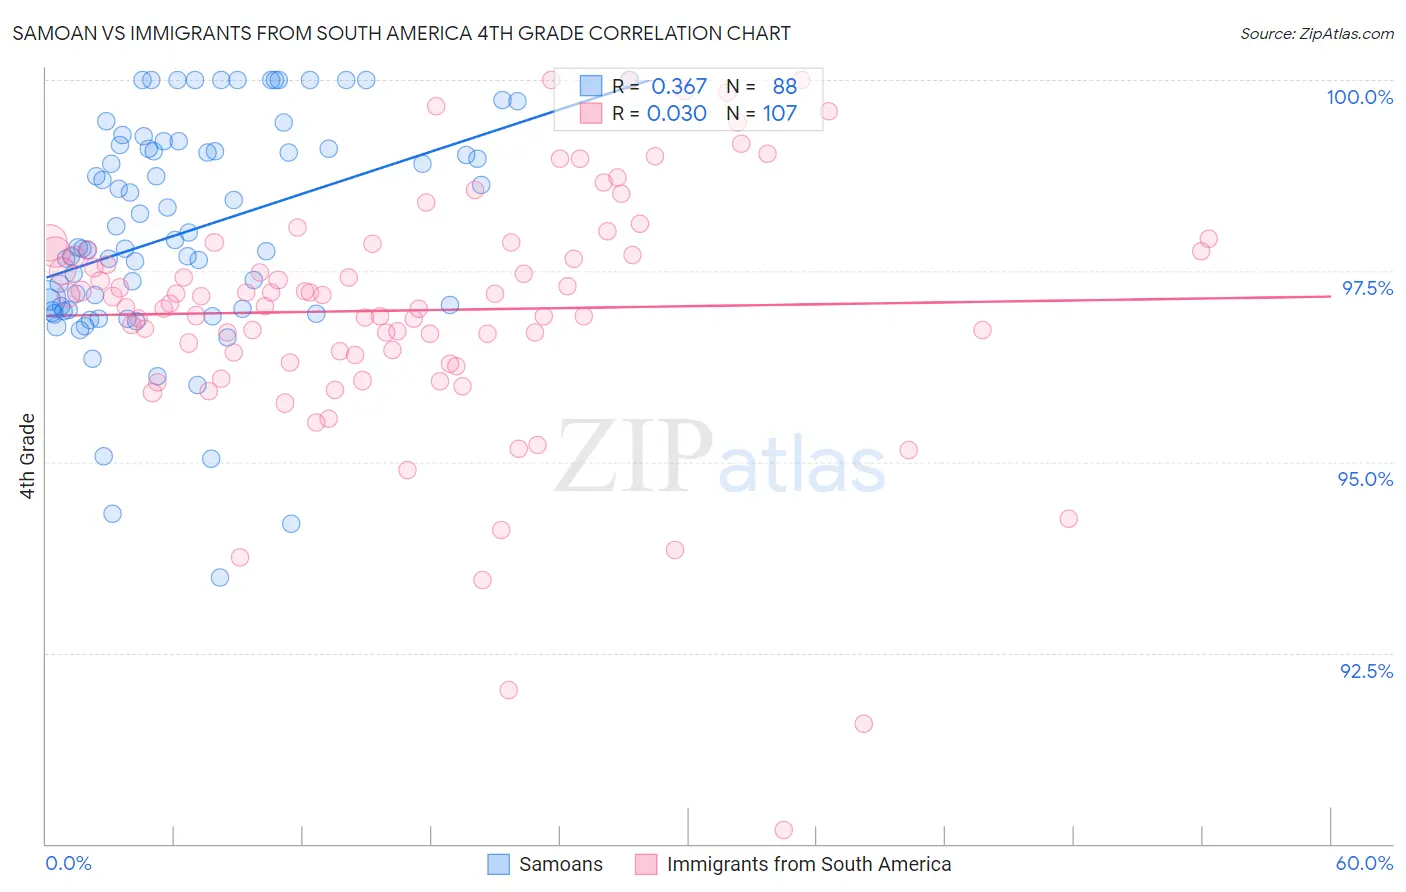
Samoan vs Immigrants from South America 4th Grade Correlation Chart
The statistical analysis conducted on geographies consisting of 225,205,818 people shows a mild positive correlation between the proportion of Samoans and percentage of population with at least 4th grade education in the United States with a correlation coefficient (R) of 0.367 and weighted average of 97.3%. Similarly, the statistical analysis conducted on geographies consisting of 486,429,719 people shows no correlation between the proportion of Immigrants from South America and percentage of population with at least 4th grade education in the United States with a correlation coefficient (R) of 0.030 and weighted average of 97.0%, a difference of 0.28%.
4th Grade Correlation Summary
| Measurement | Samoan | Immigrants from South America |
| Minimum | 93.5% | 90.2% |
| Maximum | 100.0% | 100.0% |
| Range | 6.5% | 9.8% |
| Mean | 98.0% | 97.0% |
| Median | 97.9% | 97.2% |
| Interquartile 25% (IQ1) | 97.0% | 96.4% |
| Interquartile 75% (IQ3) | 99.1% | 97.8% |
| Interquartile Range (IQR) | 2.1% | 1.4% |
| Standard Deviation (Sample) | 1.5% | 1.7% |
| Standard Deviation (Population) | 1.5% | 1.6% |
Similar Demographics by 4th Grade
Demographics Similar to Samoans by 4th Grade
In terms of 4th grade, the demographic groups most similar to Samoans are Immigrants from Morocco (97.3%, a difference of 0.0%), Sierra Leonean (97.3%, a difference of 0.0%), Immigrants from Nepal (97.3%, a difference of 0.010%), Iraqi (97.3%, a difference of 0.010%), and Tohono O'odham (97.3%, a difference of 0.020%).
| Demographics | Rating | Rank | 4th Grade |
| Laotians | 9.3 /100 | #209 | Tragic 97.3% |
| Immigrants | Oceania | 9.1 /100 | #210 | Tragic 97.3% |
| Sudanese | 9.0 /100 | #211 | Tragic 97.3% |
| Tohono O'odham | 8.4 /100 | #212 | Tragic 97.3% |
| Costa Ricans | 8.3 /100 | #213 | Tragic 97.3% |
| Immigrants | Nepal | 7.7 /100 | #214 | Tragic 97.3% |
| Immigrants | Morocco | 7.1 /100 | #215 | Tragic 97.3% |
| Samoans | 6.8 /100 | #216 | Tragic 97.3% |
| Sierra Leoneans | 6.5 /100 | #217 | Tragic 97.3% |
| Iraqis | 6.3 /100 | #218 | Tragic 97.3% |
| Tongans | 5.8 /100 | #219 | Tragic 97.3% |
| South American Indians | 5.5 /100 | #220 | Tragic 97.3% |
| Immigrants | Panama | 5.4 /100 | #221 | Tragic 97.3% |
| Immigrants | Lebanon | 5.1 /100 | #222 | Tragic 97.3% |
| Immigrants | Sudan | 5.0 /100 | #223 | Tragic 97.2% |
Demographics Similar to Immigrants from South America by 4th Grade
In terms of 4th grade, the demographic groups most similar to Immigrants from South America are Immigrants from Sierra Leone (97.0%, a difference of 0.0%), West Indian (97.0%, a difference of 0.010%), Immigrants from Jamaica (97.0%, a difference of 0.010%), Immigrants from Congo (97.0%, a difference of 0.020%), and Immigrants from Colombia (97.0%, a difference of 0.020%).
| Demographics | Rating | Rank | 4th Grade |
| Immigrants | Middle Africa | 0.8 /100 | #254 | Tragic 97.1% |
| Peruvians | 0.7 /100 | #255 | Tragic 97.1% |
| Bolivians | 0.7 /100 | #256 | Tragic 97.1% |
| Immigrants | Congo | 0.5 /100 | #257 | Tragic 97.0% |
| Immigrants | Colombia | 0.5 /100 | #258 | Tragic 97.0% |
| Immigrants | Ethiopia | 0.4 /100 | #259 | Tragic 97.0% |
| Immigrants | Sierra Leone | 0.4 /100 | #260 | Tragic 97.0% |
| Immigrants | South America | 0.4 /100 | #261 | Tragic 97.0% |
| West Indians | 0.4 /100 | #262 | Tragic 97.0% |
| Immigrants | Jamaica | 0.3 /100 | #263 | Tragic 97.0% |
| Taiwanese | 0.3 /100 | #264 | Tragic 97.0% |
| Armenians | 0.3 /100 | #265 | Tragic 97.0% |
| Immigrants | China | 0.3 /100 | #266 | Tragic 97.0% |
| Immigrants | Nigeria | 0.3 /100 | #267 | Tragic 97.0% |
| Ghanaians | 0.2 /100 | #268 | Tragic 97.0% |