Samoan vs Immigrants from Belarus 4th Grade
COMPARE
Samoan
Immigrants from Belarus
4th Grade
4th Grade Comparison
Samoans
Immigrants from Belarus
97.3%
4TH GRADE
6.8/ 100
METRIC RATING
216th/ 347
METRIC RANK
97.5%
4TH GRADE
55.8/ 100
METRIC RATING
168th/ 347
METRIC RANK
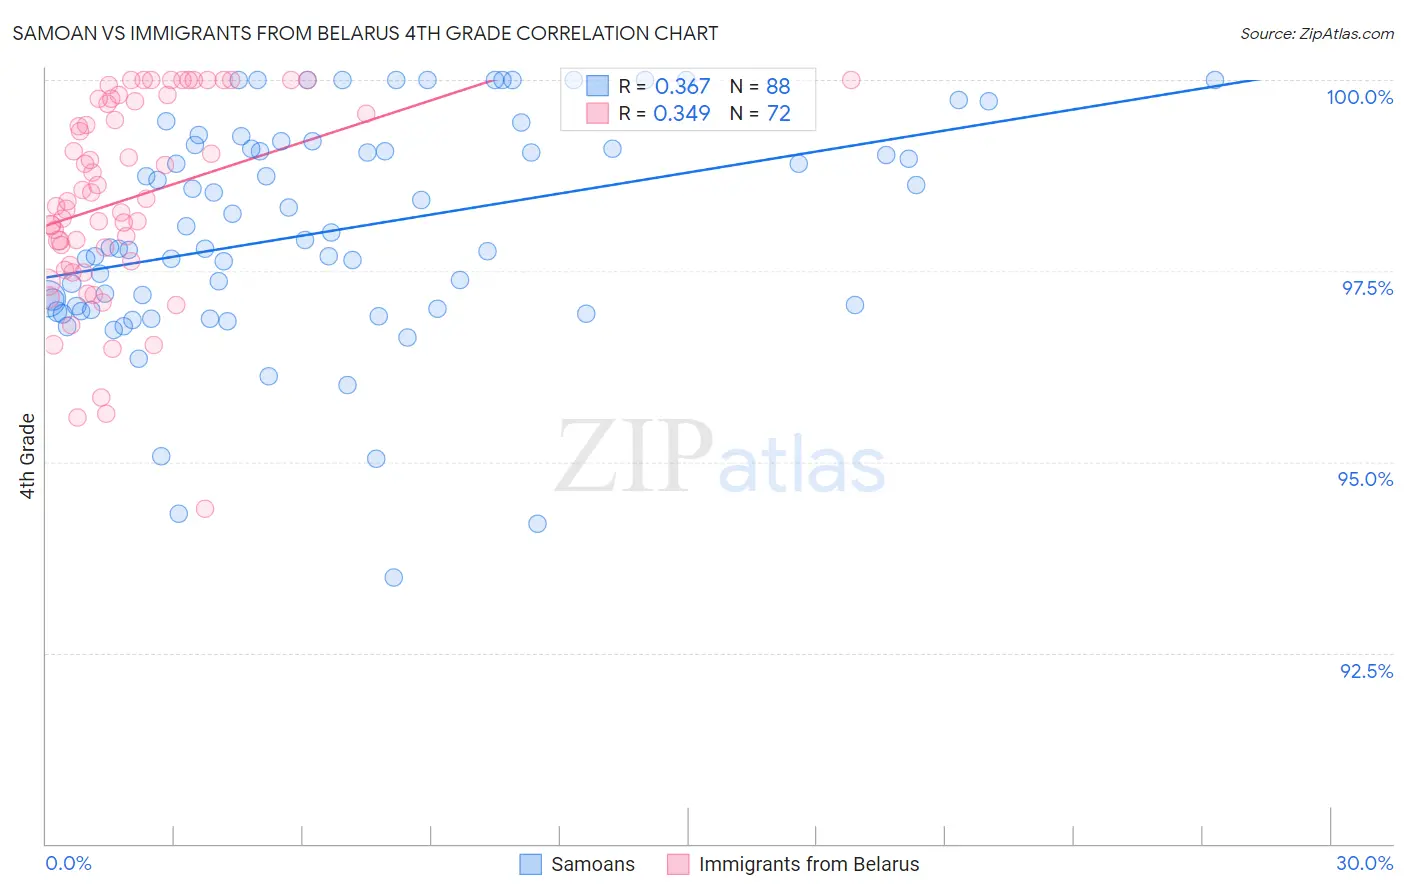
Samoan vs Immigrants from Belarus 4th Grade Correlation Chart
The statistical analysis conducted on geographies consisting of 225,205,818 people shows a mild positive correlation between the proportion of Samoans and percentage of population with at least 4th grade education in the United States with a correlation coefficient (R) of 0.367 and weighted average of 97.3%. Similarly, the statistical analysis conducted on geographies consisting of 149,993,317 people shows a mild positive correlation between the proportion of Immigrants from Belarus and percentage of population with at least 4th grade education in the United States with a correlation coefficient (R) of 0.349 and weighted average of 97.5%, a difference of 0.27%.
4th Grade Correlation Summary
| Measurement | Samoan | Immigrants from Belarus |
| Minimum | 93.5% | 94.4% |
| Maximum | 100.0% | 100.0% |
| Range | 6.5% | 5.6% |
| Mean | 98.0% | 98.5% |
| Median | 97.9% | 98.4% |
| Interquartile 25% (IQ1) | 97.0% | 97.6% |
| Interquartile 75% (IQ3) | 99.1% | 99.7% |
| Interquartile Range (IQR) | 2.1% | 2.1% |
| Standard Deviation (Sample) | 1.5% | 1.3% |
| Standard Deviation (Population) | 1.5% | 1.3% |
Similar Demographics by 4th Grade
Demographics Similar to Samoans by 4th Grade
In terms of 4th grade, the demographic groups most similar to Samoans are Immigrants from Morocco (97.3%, a difference of 0.0%), Sierra Leonean (97.3%, a difference of 0.0%), Immigrants from Nepal (97.3%, a difference of 0.010%), Iraqi (97.3%, a difference of 0.010%), and Tohono O'odham (97.3%, a difference of 0.020%).
| Demographics | Rating | Rank | 4th Grade |
| Laotians | 9.3 /100 | #209 | Tragic 97.3% |
| Immigrants | Oceania | 9.1 /100 | #210 | Tragic 97.3% |
| Sudanese | 9.0 /100 | #211 | Tragic 97.3% |
| Tohono O'odham | 8.4 /100 | #212 | Tragic 97.3% |
| Costa Ricans | 8.3 /100 | #213 | Tragic 97.3% |
| Immigrants | Nepal | 7.7 /100 | #214 | Tragic 97.3% |
| Immigrants | Morocco | 7.1 /100 | #215 | Tragic 97.3% |
| Samoans | 6.8 /100 | #216 | Tragic 97.3% |
| Sierra Leoneans | 6.5 /100 | #217 | Tragic 97.3% |
| Iraqis | 6.3 /100 | #218 | Tragic 97.3% |
| Tongans | 5.8 /100 | #219 | Tragic 97.3% |
| South American Indians | 5.5 /100 | #220 | Tragic 97.3% |
| Immigrants | Panama | 5.4 /100 | #221 | Tragic 97.3% |
| Immigrants | Lebanon | 5.1 /100 | #222 | Tragic 97.3% |
| Immigrants | Sudan | 5.0 /100 | #223 | Tragic 97.2% |
Demographics Similar to Immigrants from Belarus by 4th Grade
In terms of 4th grade, the demographic groups most similar to Immigrants from Belarus are Kenyan (97.5%, a difference of 0.0%), Immigrants from Poland (97.5%, a difference of 0.0%), Ugandan (97.6%, a difference of 0.010%), Venezuelan (97.6%, a difference of 0.010%), and Chilean (97.5%, a difference of 0.010%).
| Demographics | Rating | Rank | 4th Grade |
| Marshallese | 60.8 /100 | #161 | Good 97.6% |
| Bermudans | 60.5 /100 | #162 | Good 97.6% |
| Immigrants | Iran | 60.3 /100 | #163 | Good 97.6% |
| Ugandans | 58.9 /100 | #164 | Average 97.6% |
| Venezuelans | 58.7 /100 | #165 | Average 97.6% |
| Kenyans | 56.5 /100 | #166 | Average 97.5% |
| Immigrants | Poland | 55.9 /100 | #167 | Average 97.5% |
| Immigrants | Belarus | 55.8 /100 | #168 | Average 97.5% |
| Chileans | 54.4 /100 | #169 | Average 97.5% |
| Immigrants | Spain | 51.8 /100 | #170 | Average 97.5% |
| Brazilians | 51.5 /100 | #171 | Average 97.5% |
| Immigrants | Sri Lanka | 51.1 /100 | #172 | Average 97.5% |
| Immigrants | Korea | 50.6 /100 | #173 | Average 97.5% |
| Egyptians | 50.0 /100 | #174 | Average 97.5% |
| Immigrants | Micronesia | 49.6 /100 | #175 | Average 97.5% |