Samoan vs Nigerian Unemployment Among Ages 65 to 74 years
COMPARE
Samoan
Nigerian
Unemployment Among Ages 65 to 74 years
Unemployment Among Ages 65 to 74 years Comparison
Samoans
Nigerians
5.5%
UNEMPLOYMENT AMONG AGES 65 TO 74 YEARS
5.7/ 100
METRIC RATING
218th/ 347
METRIC RANK
5.5%
UNEMPLOYMENT AMONG AGES 65 TO 74 YEARS
2.5/ 100
METRIC RATING
232nd/ 347
METRIC RANK
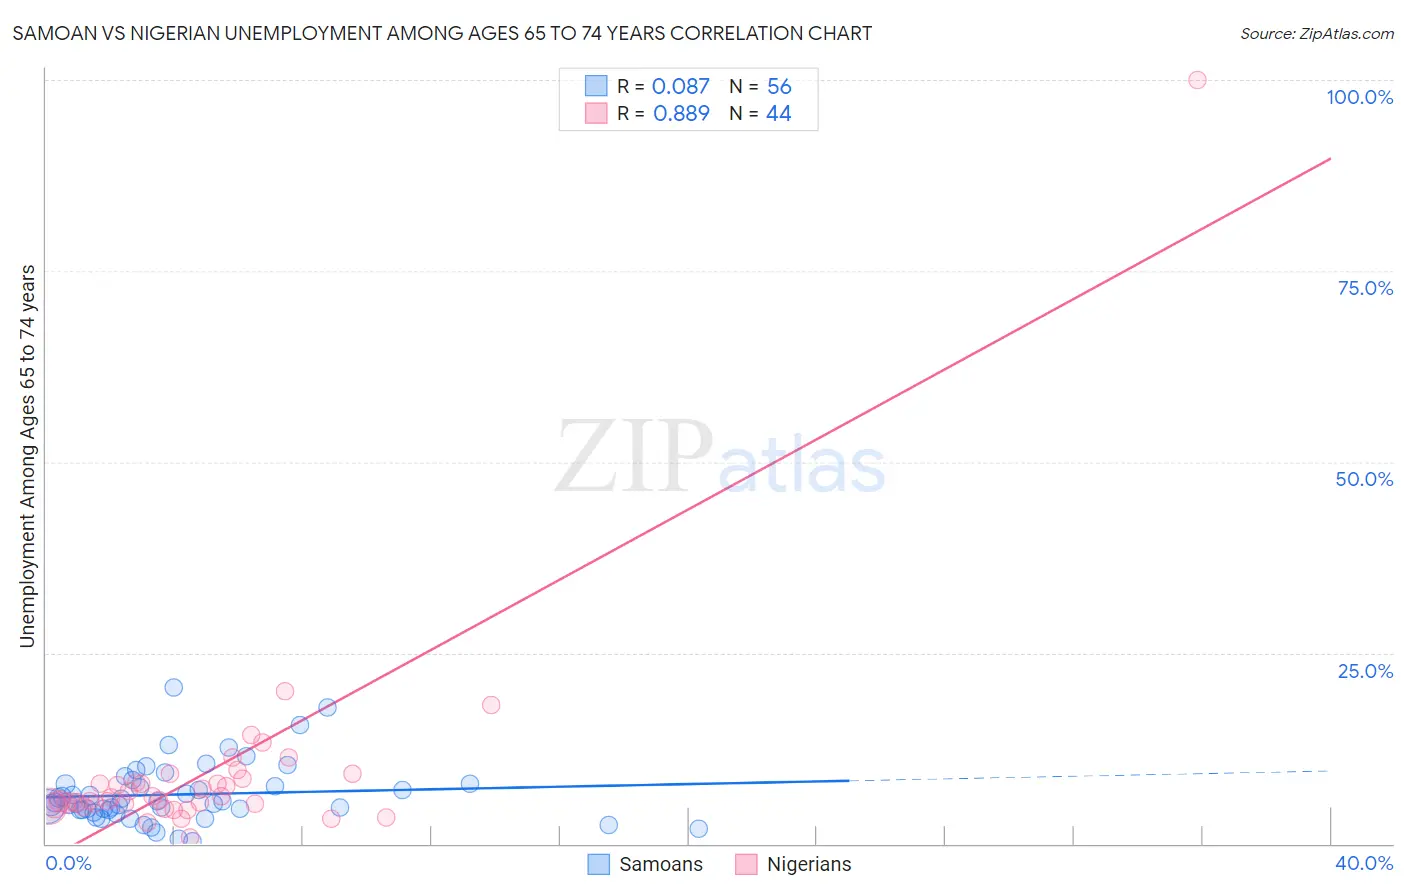
Samoan vs Nigerian Unemployment Among Ages 65 to 74 years Correlation Chart
The statistical analysis conducted on geographies consisting of 206,102,942 people shows a slight positive correlation between the proportion of Samoans and unemployment rate among population between the ages 65 and 74 in the United States with a correlation coefficient (R) of 0.087 and weighted average of 5.5%. Similarly, the statistical analysis conducted on geographies consisting of 301,316,901 people shows a very strong positive correlation between the proportion of Nigerians and unemployment rate among population between the ages 65 and 74 in the United States with a correlation coefficient (R) of 0.889 and weighted average of 5.5%, a difference of 0.69%.
Unemployment Among Ages 65 to 74 years Correlation Summary
| Measurement | Samoan | Nigerian |
| Minimum | 0.30% | 0.77% |
| Maximum | 20.4% | 100.0% |
| Range | 20.1% | 99.2% |
| Mean | 6.5% | 9.2% |
| Median | 5.4% | 5.9% |
| Interquartile 25% (IQ1) | 4.4% | 5.1% |
| Interquartile 75% (IQ3) | 7.8% | 8.2% |
| Interquartile Range (IQR) | 3.4% | 3.1% |
| Standard Deviation (Sample) | 3.9% | 14.5% |
| Standard Deviation (Population) | 3.9% | 14.3% |
Demographics Similar to Samoans and Nigerians by Unemployment Among Ages 65 to 74 years
In terms of unemployment among ages 65 to 74 years, the demographic groups most similar to Samoans are Blackfeet (5.5%, a difference of 0.020%), Alsatian (5.5%, a difference of 0.020%), Uruguayan (5.5%, a difference of 0.080%), Immigrants from Syria (5.5%, a difference of 0.10%), and Spaniard (5.5%, a difference of 0.15%). Similarly, the demographic groups most similar to Nigerians are Israeli (5.5%, a difference of 0.010%), Immigrants from Caribbean (5.5%, a difference of 0.050%), West Indian (5.5%, a difference of 0.070%), South American Indian (5.5%, a difference of 0.090%), and French American Indian (5.5%, a difference of 0.10%).
| Demographics | Rating | Rank | Unemployment Among Ages 65 to 74 years |
| Americans | 7.3 /100 | #215 | Tragic 5.5% |
| Uruguayans | 6.2 /100 | #216 | Tragic 5.5% |
| Blackfeet | 5.8 /100 | #217 | Tragic 5.5% |
| Samoans | 5.7 /100 | #218 | Tragic 5.5% |
| Alsatians | 5.6 /100 | #219 | Tragic 5.5% |
| Immigrants | Syria | 5.1 /100 | #220 | Tragic 5.5% |
| Spaniards | 4.8 /100 | #221 | Tragic 5.5% |
| Apache | 4.5 /100 | #222 | Tragic 5.5% |
| Hungarians | 4.4 /100 | #223 | Tragic 5.5% |
| Immigrants | Uruguay | 4.2 /100 | #224 | Tragic 5.5% |
| Immigrants | Trinidad and Tobago | 4.1 /100 | #225 | Tragic 5.5% |
| Hondurans | 3.7 /100 | #226 | Tragic 5.5% |
| Immigrants | Albania | 3.7 /100 | #227 | Tragic 5.5% |
| Immigrants | Israel | 3.0 /100 | #228 | Tragic 5.5% |
| West Indians | 2.7 /100 | #229 | Tragic 5.5% |
| Immigrants | Caribbean | 2.7 /100 | #230 | Tragic 5.5% |
| Israelis | 2.5 /100 | #231 | Tragic 5.5% |
| Nigerians | 2.5 /100 | #232 | Tragic 5.5% |
| South American Indians | 2.3 /100 | #233 | Tragic 5.5% |
| French American Indians | 2.2 /100 | #234 | Tragic 5.5% |
| Peruvians | 2.2 /100 | #235 | Tragic 5.5% |