Samoan vs Immigrants from Hungary 12th Grade, No Diploma
COMPARE
Samoan
Immigrants from Hungary
12th Grade, No Diploma
12th Grade, No Diploma Comparison
Samoans
Immigrants from Hungary
90.8%
12TH GRADE, NO DIPLOMA
20.4/ 100
METRIC RATING
198th/ 347
METRIC RANK
92.1%
12TH GRADE, NO DIPLOMA
97.0/ 100
METRIC RATING
109th/ 347
METRIC RANK
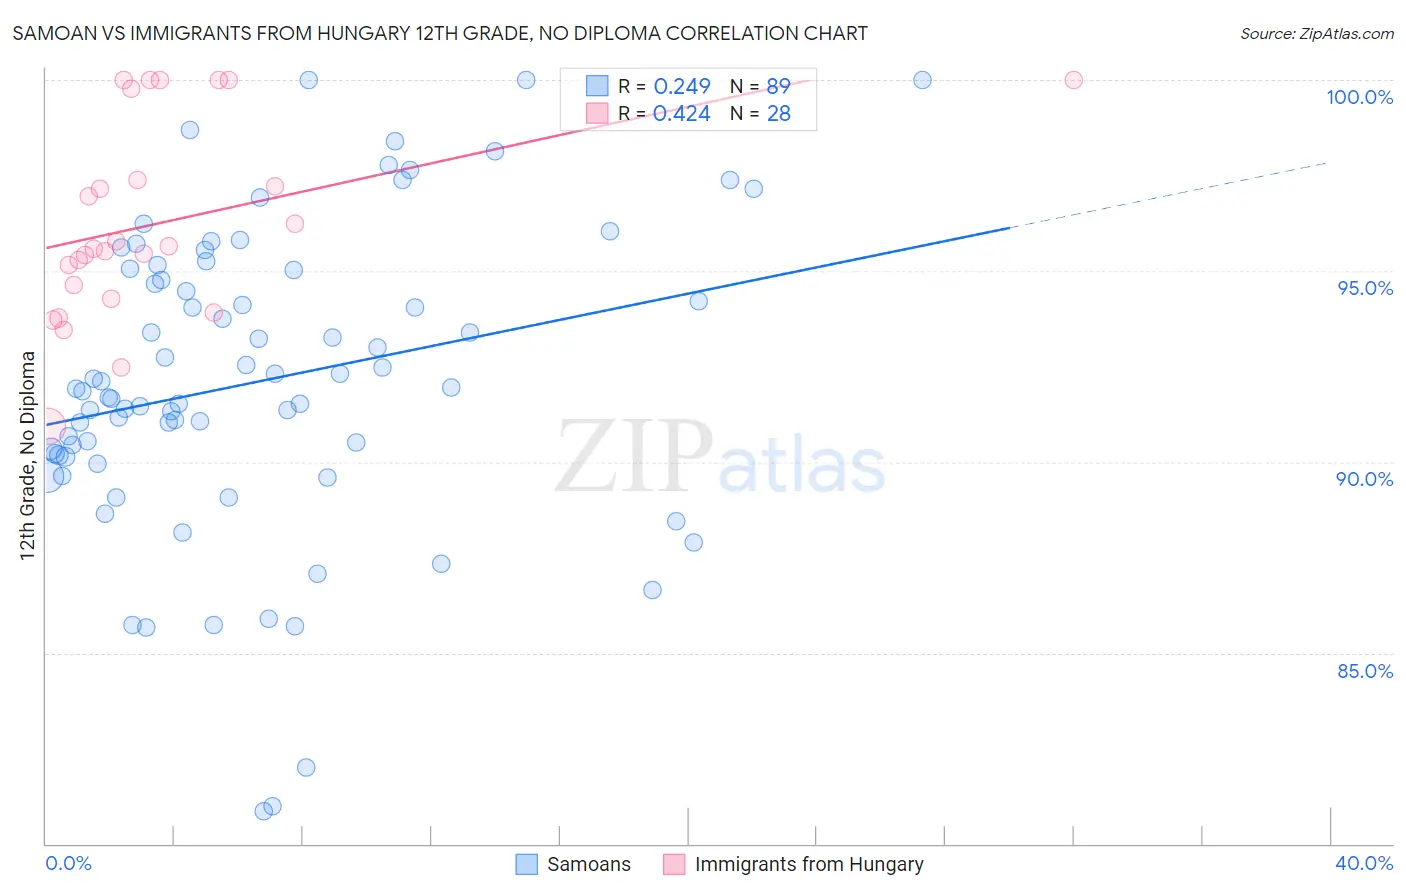
Samoan vs Immigrants from Hungary 12th Grade, No Diploma Correlation Chart
The statistical analysis conducted on geographies consisting of 225,206,099 people shows a weak positive correlation between the proportion of Samoans and percentage of population with at least 12th grade (no diploma) education in the United States with a correlation coefficient (R) of 0.249 and weighted average of 90.8%. Similarly, the statistical analysis conducted on geographies consisting of 195,707,305 people shows a moderate positive correlation between the proportion of Immigrants from Hungary and percentage of population with at least 12th grade (no diploma) education in the United States with a correlation coefficient (R) of 0.424 and weighted average of 92.1%, a difference of 1.5%.
12th Grade, No Diploma Correlation Summary
| Measurement | Samoan | Immigrants from Hungary |
| Minimum | 80.8% | 90.9% |
| Maximum | 100.0% | 100.0% |
| Range | 19.2% | 9.1% |
| Mean | 92.1% | 96.3% |
| Median | 91.9% | 95.6% |
| Interquartile 25% (IQ1) | 90.2% | 94.5% |
| Interquartile 75% (IQ3) | 95.0% | 98.6% |
| Interquartile Range (IQR) | 4.9% | 4.1% |
| Standard Deviation (Sample) | 4.0% | 2.6% |
| Standard Deviation (Population) | 4.0% | 2.5% |
Similar Demographics by 12th Grade, No Diploma
Demographics Similar to Samoans by 12th Grade, No Diploma
In terms of 12th grade, no diploma, the demographic groups most similar to Samoans are Immigrants from Southern Europe (90.8%, a difference of 0.010%), Liberian (90.8%, a difference of 0.010%), Hawaiian (90.8%, a difference of 0.010%), Panamanian (90.8%, a difference of 0.040%), and Immigrants from Sudan (90.8%, a difference of 0.040%).
| Demographics | Rating | Rank | 12th Grade, No Diploma |
| Moroccans | 28.8 /100 | #191 | Fair 90.9% |
| Immigrants | Eastern Africa | 27.7 /100 | #192 | Fair 90.9% |
| Immigrants | Ethiopia | 27.2 /100 | #193 | Fair 90.9% |
| Immigrants | Oceania | 26.0 /100 | #194 | Fair 90.9% |
| Koreans | 24.5 /100 | #195 | Fair 90.8% |
| Panamanians | 22.8 /100 | #196 | Fair 90.8% |
| Immigrants | Sudan | 22.6 /100 | #197 | Fair 90.8% |
| Samoans | 20.4 /100 | #198 | Fair 90.8% |
| Immigrants | Southern Europe | 19.9 /100 | #199 | Poor 90.8% |
| Liberians | 19.8 /100 | #200 | Poor 90.8% |
| Hawaiians | 19.7 /100 | #201 | Poor 90.8% |
| Marshallese | 18.2 /100 | #202 | Poor 90.7% |
| Tongans | 16.1 /100 | #203 | Poor 90.7% |
| French American Indians | 15.5 /100 | #204 | Poor 90.7% |
| Immigrants | Sierra Leone | 14.9 /100 | #205 | Poor 90.7% |
Demographics Similar to Immigrants from Hungary by 12th Grade, No Diploma
In terms of 12th grade, no diploma, the demographic groups most similar to Immigrants from Hungary are Palestinian (92.1%, a difference of 0.0%), Immigrants from Greece (92.1%, a difference of 0.010%), Syrian (92.2%, a difference of 0.020%), Jordanian (92.2%, a difference of 0.020%), and Israeli (92.1%, a difference of 0.020%).
| Demographics | Rating | Rank | 12th Grade, No Diploma |
| Alaskan Athabascans | 98.1 /100 | #102 | Exceptional 92.3% |
| Immigrants | Norway | 98.1 /100 | #103 | Exceptional 92.3% |
| Lebanese | 97.6 /100 | #104 | Exceptional 92.2% |
| Immigrants | Belarus | 97.4 /100 | #105 | Exceptional 92.2% |
| Immigrants | Russia | 97.3 /100 | #106 | Exceptional 92.2% |
| Syrians | 97.2 /100 | #107 | Exceptional 92.2% |
| Jordanians | 97.2 /100 | #108 | Exceptional 92.2% |
| Immigrants | Hungary | 97.0 /100 | #109 | Exceptional 92.1% |
| Palestinians | 97.0 /100 | #110 | Exceptional 92.1% |
| Immigrants | Greece | 96.9 /100 | #111 | Exceptional 92.1% |
| Israelis | 96.8 /100 | #112 | Exceptional 92.1% |
| Immigrants | Zimbabwe | 96.5 /100 | #113 | Exceptional 92.1% |
| Yugoslavians | 96.5 /100 | #114 | Exceptional 92.1% |
| Immigrants | Sri Lanka | 96.4 /100 | #115 | Exceptional 92.1% |
| Aleuts | 96.3 /100 | #116 | Exceptional 92.1% |