Samoan vs Immigrants from Ireland Master's Degree
COMPARE
Samoan
Immigrants from Ireland
Master's Degree
Master's Degree Comparison
Samoans
Immigrants from Ireland
11.5%
MASTER'S DEGREE
0.1/ 100
METRIC RATING
298th/ 347
METRIC RANK
20.4%
MASTER'S DEGREE
100.0/ 100
METRIC RATING
21st/ 347
METRIC RANK
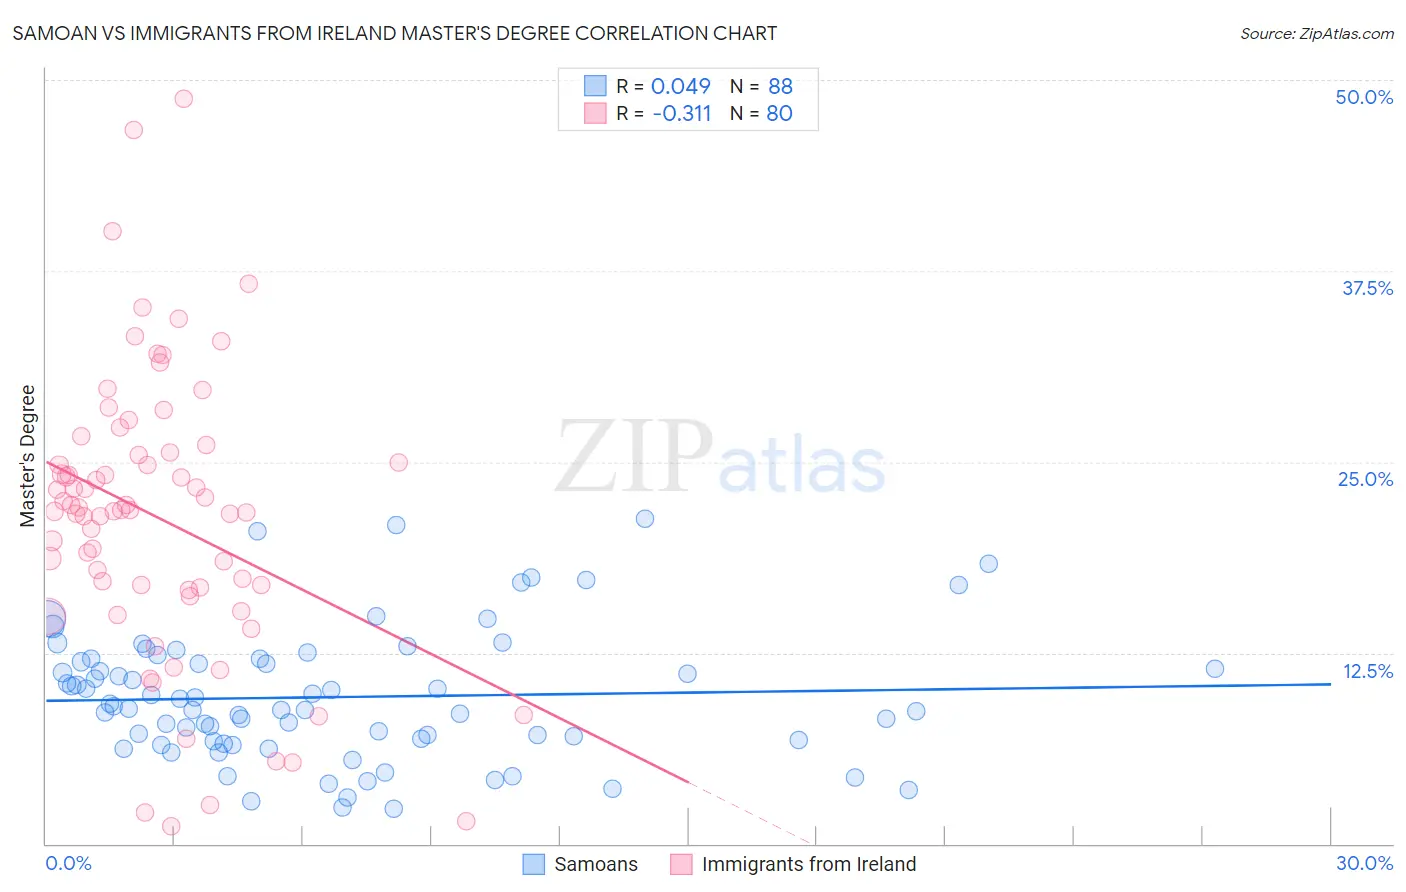
Samoan vs Immigrants from Ireland Master's Degree Correlation Chart
The statistical analysis conducted on geographies consisting of 225,135,673 people shows no correlation between the proportion of Samoans and percentage of population with at least master's degree education in the United States with a correlation coefficient (R) of 0.049 and weighted average of 11.5%. Similarly, the statistical analysis conducted on geographies consisting of 240,764,624 people shows a mild negative correlation between the proportion of Immigrants from Ireland and percentage of population with at least master's degree education in the United States with a correlation coefficient (R) of -0.311 and weighted average of 20.4%, a difference of 78.0%.
Master's Degree Correlation Summary
| Measurement | Samoan | Immigrants from Ireland |
| Minimum | 2.3% | 1.1% |
| Maximum | 21.3% | 48.7% |
| Range | 19.0% | 47.6% |
| Mean | 9.6% | 21.3% |
| Median | 8.9% | 21.8% |
| Interquartile 25% (IQ1) | 6.7% | 16.7% |
| Interquartile 75% (IQ3) | 12.0% | 25.5% |
| Interquartile Range (IQR) | 5.3% | 8.8% |
| Standard Deviation (Sample) | 4.2% | 9.3% |
| Standard Deviation (Population) | 4.2% | 9.3% |
Similar Demographics by Master's Degree
Demographics Similar to Samoans by Master's Degree
In terms of master's degree, the demographic groups most similar to Samoans are Chickasaw (11.4%, a difference of 0.46%), Chippewa (11.4%, a difference of 0.48%), Tsimshian (11.4%, a difference of 0.64%), Immigrants from Yemen (11.6%, a difference of 0.71%), and Marshallese (11.6%, a difference of 0.84%).
| Demographics | Rating | Rank | Master's Degree |
| Colville | 0.1 /100 | #291 | Tragic 11.6% |
| Immigrants | Guatemala | 0.1 /100 | #292 | Tragic 11.6% |
| Alaska Natives | 0.1 /100 | #293 | Tragic 11.6% |
| Hawaiians | 0.1 /100 | #294 | Tragic 11.6% |
| Marshallese | 0.1 /100 | #295 | Tragic 11.6% |
| Alaskan Athabascans | 0.1 /100 | #296 | Tragic 11.6% |
| Immigrants | Yemen | 0.1 /100 | #297 | Tragic 11.6% |
| Samoans | 0.1 /100 | #298 | Tragic 11.5% |
| Chickasaw | 0.1 /100 | #299 | Tragic 11.4% |
| Chippewa | 0.1 /100 | #300 | Tragic 11.4% |
| Tsimshian | 0.1 /100 | #301 | Tragic 11.4% |
| Cherokee | 0.1 /100 | #302 | Tragic 11.4% |
| Immigrants | Laos | 0.1 /100 | #303 | Tragic 11.4% |
| Immigrants | Cabo Verde | 0.1 /100 | #304 | Tragic 11.3% |
| Immigrants | Latin America | 0.0 /100 | #305 | Tragic 11.3% |
Demographics Similar to Immigrants from Ireland by Master's Degree
In terms of master's degree, the demographic groups most similar to Immigrants from Ireland are Indian (Asian) (20.5%, a difference of 0.11%), Immigrants from Hong Kong (20.5%, a difference of 0.13%), Israeli (20.3%, a difference of 0.42%), Soviet Union (20.5%, a difference of 0.48%), and Immigrants from France (20.3%, a difference of 0.70%).
| Demographics | Rating | Rank | Master's Degree |
| Immigrants | Switzerland | 100.0 /100 | #14 | Exceptional 20.9% |
| Immigrants | Eastern Asia | 100.0 /100 | #15 | Exceptional 20.8% |
| Immigrants | Belgium | 100.0 /100 | #16 | Exceptional 20.8% |
| Immigrants | South Central Asia | 100.0 /100 | #17 | Exceptional 20.7% |
| Soviet Union | 100.0 /100 | #18 | Exceptional 20.5% |
| Immigrants | Hong Kong | 100.0 /100 | #19 | Exceptional 20.5% |
| Indians (Asian) | 100.0 /100 | #20 | Exceptional 20.5% |
| Immigrants | Ireland | 100.0 /100 | #21 | Exceptional 20.4% |
| Israelis | 100.0 /100 | #22 | Exceptional 20.3% |
| Immigrants | France | 100.0 /100 | #23 | Exceptional 20.3% |
| Immigrants | Sweden | 100.0 /100 | #24 | Exceptional 20.3% |
| Immigrants | Japan | 100.0 /100 | #25 | Exceptional 20.0% |
| Cambodians | 100.0 /100 | #26 | Exceptional 20.0% |
| Immigrants | Sri Lanka | 100.0 /100 | #27 | Exceptional 19.9% |
| Turks | 100.0 /100 | #28 | Exceptional 19.9% |