Immigrants from Australia vs Immigrants from Uzbekistan 7th Grade
COMPARE
Immigrants from Australia
Immigrants from Uzbekistan
7th Grade
7th Grade Comparison
Immigrants from Australia
Immigrants from Uzbekistan
96.7%
7TH GRADE
98.8/ 100
METRIC RATING
95th/ 347
METRIC RANK
95.1%
7TH GRADE
0.2/ 100
METRIC RATING
273rd/ 347
METRIC RANK
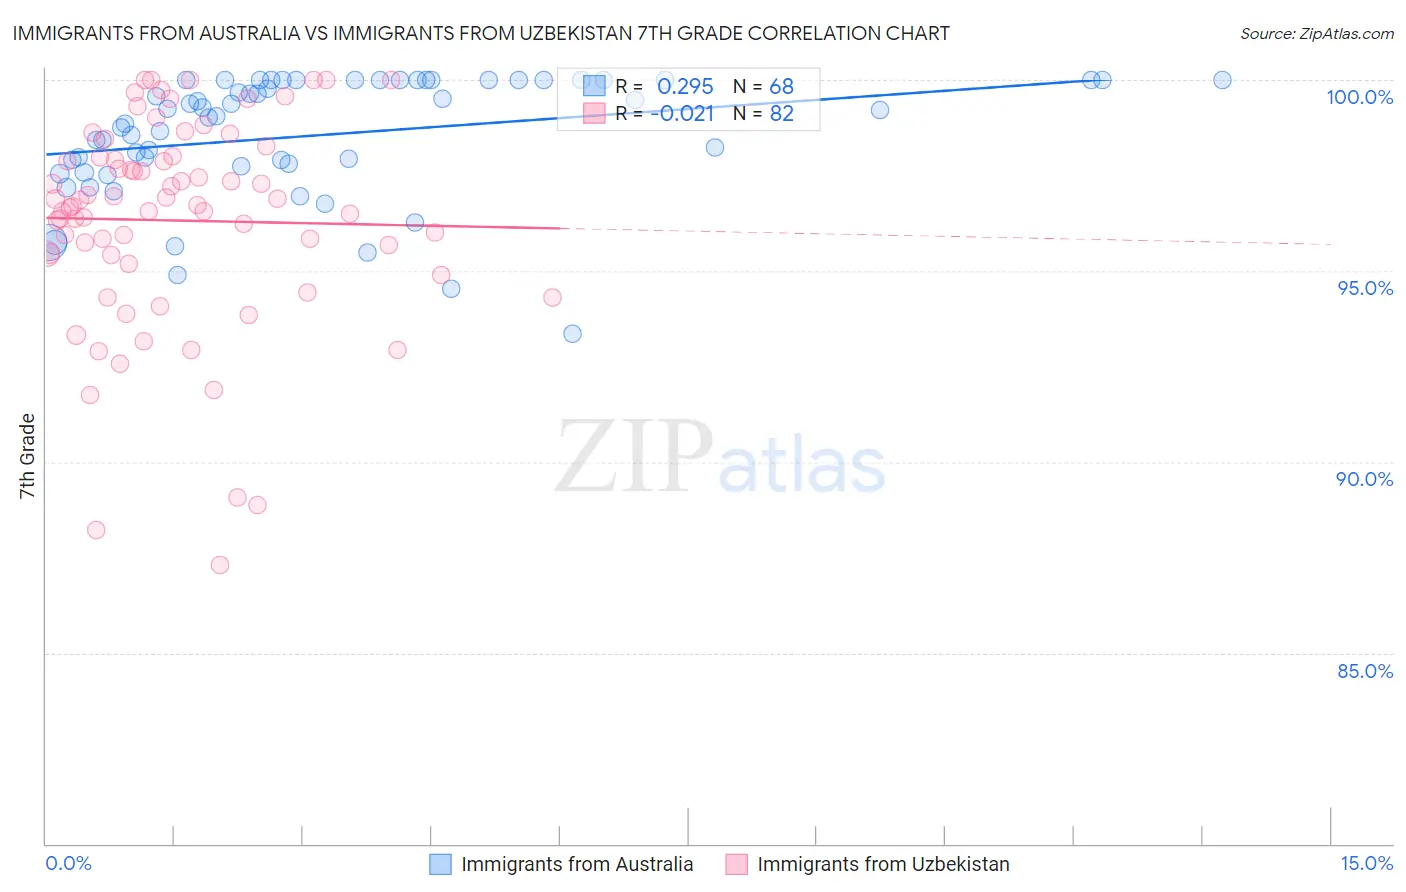
Immigrants from Australia vs Immigrants from Uzbekistan 7th Grade Correlation Chart
The statistical analysis conducted on geographies consisting of 227,203,469 people shows a weak positive correlation between the proportion of Immigrants from Australia and percentage of population with at least 7th grade education in the United States with a correlation coefficient (R) of 0.295 and weighted average of 96.7%. Similarly, the statistical analysis conducted on geographies consisting of 118,674,509 people shows no correlation between the proportion of Immigrants from Uzbekistan and percentage of population with at least 7th grade education in the United States with a correlation coefficient (R) of -0.021 and weighted average of 95.1%, a difference of 1.6%.
7th Grade Correlation Summary
| Measurement | Immigrants from Australia | Immigrants from Uzbekistan |
| Minimum | 93.4% | 87.3% |
| Maximum | 100.0% | 100.0% |
| Range | 6.6% | 12.7% |
| Mean | 98.6% | 96.3% |
| Median | 99.1% | 96.7% |
| Interquartile 25% (IQ1) | 97.8% | 95.4% |
| Interquartile 75% (IQ3) | 100.0% | 98.0% |
| Interquartile Range (IQR) | 2.2% | 2.6% |
| Standard Deviation (Sample) | 1.6% | 2.7% |
| Standard Deviation (Population) | 1.6% | 2.7% |
Similar Demographics by 7th Grade
Demographics Similar to Immigrants from Australia by 7th Grade
In terms of 7th grade, the demographic groups most similar to Immigrants from Australia are Lebanese (96.7%, a difference of 0.0%), Potawatomi (96.7%, a difference of 0.010%), Immigrants from Denmark (96.7%, a difference of 0.010%), Immigrants from Germany (96.7%, a difference of 0.010%), and Immigrants from Sweden (96.7%, a difference of 0.010%).
| Demographics | Rating | Rank | 7th Grade |
| Puget Sound Salish | 99.0 /100 | #88 | Exceptional 96.7% |
| Cree | 99.0 /100 | #89 | Exceptional 96.7% |
| Immigrants | South Africa | 98.9 /100 | #90 | Exceptional 96.7% |
| Osage | 98.9 /100 | #91 | Exceptional 96.7% |
| Immigrants | Western Europe | 98.9 /100 | #92 | Exceptional 96.7% |
| Potawatomi | 98.9 /100 | #93 | Exceptional 96.7% |
| Lebanese | 98.8 /100 | #94 | Exceptional 96.7% |
| Immigrants | Australia | 98.8 /100 | #95 | Exceptional 96.7% |
| Immigrants | Denmark | 98.7 /100 | #96 | Exceptional 96.7% |
| Immigrants | Germany | 98.7 /100 | #97 | Exceptional 96.7% |
| Immigrants | Sweden | 98.7 /100 | #98 | Exceptional 96.7% |
| Menominee | 98.7 /100 | #99 | Exceptional 96.7% |
| German Russians | 98.6 /100 | #100 | Exceptional 96.7% |
| Thais | 98.6 /100 | #101 | Exceptional 96.7% |
| Immigrants | Czechoslovakia | 98.3 /100 | #102 | Exceptional 96.6% |
Demographics Similar to Immigrants from Uzbekistan by 7th Grade
In terms of 7th grade, the demographic groups most similar to Immigrants from Uzbekistan are Immigrants from South America (95.1%, a difference of 0.0%), Peruvian (95.1%, a difference of 0.0%), Immigrants from Western Africa (95.1%, a difference of 0.0%), Houma (95.1%, a difference of 0.010%), and Immigrants from Colombia (95.1%, a difference of 0.010%).
| Demographics | Rating | Rank | 7th Grade |
| Immigrants | Ghana | 0.3 /100 | #266 | Tragic 95.2% |
| Yuman | 0.3 /100 | #267 | Tragic 95.2% |
| Immigrants | Hong Kong | 0.3 /100 | #268 | Tragic 95.2% |
| Trinidadians and Tobagonians | 0.3 /100 | #269 | Tragic 95.2% |
| Houma | 0.2 /100 | #270 | Tragic 95.1% |
| Immigrants | South America | 0.2 /100 | #271 | Tragic 95.1% |
| Peruvians | 0.2 /100 | #272 | Tragic 95.1% |
| Immigrants | Uzbekistan | 0.2 /100 | #273 | Tragic 95.1% |
| Immigrants | Western Africa | 0.2 /100 | #274 | Tragic 95.1% |
| Immigrants | Colombia | 0.2 /100 | #275 | Tragic 95.1% |
| Immigrants | Thailand | 0.2 /100 | #276 | Tragic 95.1% |
| Immigrants | Afghanistan | 0.2 /100 | #277 | Tragic 95.1% |
| Immigrants | Trinidad and Tobago | 0.1 /100 | #278 | Tragic 95.1% |
| Barbadians | 0.1 /100 | #279 | Tragic 95.1% |
| Immigrants | St. Vincent and the Grenadines | 0.1 /100 | #280 | Tragic 95.0% |