Cuban vs Immigrants from Honduras 9th Grade
COMPARE
Cuban
Immigrants from Honduras
9th Grade
9th Grade Comparison
Cubans
Immigrants from Honduras
93.2%
9TH GRADE
0.0/ 100
METRIC RATING
294th/ 347
METRIC RANK
90.6%
9TH GRADE
0.0/ 100
METRIC RATING
335th/ 347
METRIC RANK
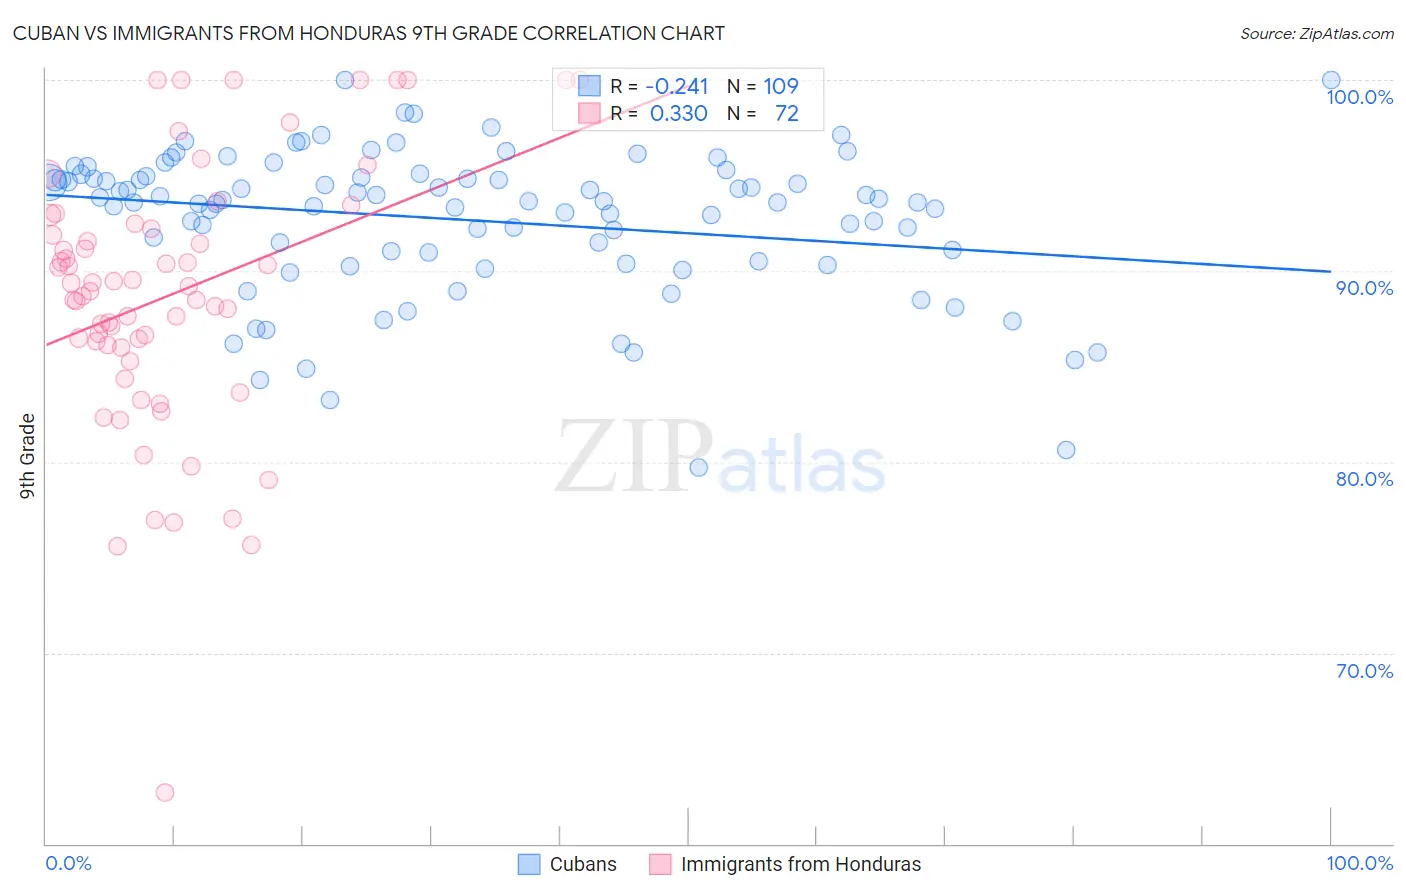
Cuban vs Immigrants from Honduras 9th Grade Correlation Chart
The statistical analysis conducted on geographies consisting of 449,368,946 people shows a weak negative correlation between the proportion of Cubans and percentage of population with at least 9th grade education in the United States with a correlation coefficient (R) of -0.241 and weighted average of 93.2%. Similarly, the statistical analysis conducted on geographies consisting of 322,637,445 people shows a mild positive correlation between the proportion of Immigrants from Honduras and percentage of population with at least 9th grade education in the United States with a correlation coefficient (R) of 0.330 and weighted average of 90.6%, a difference of 2.8%.
9th Grade Correlation Summary
| Measurement | Cuban | Immigrants from Honduras |
| Minimum | 79.7% | 62.7% |
| Maximum | 100.0% | 100.0% |
| Range | 20.3% | 37.3% |
| Mean | 92.7% | 88.7% |
| Median | 93.6% | 89.1% |
| Interquartile 25% (IQ1) | 90.7% | 86.1% |
| Interquartile 75% (IQ3) | 94.9% | 92.3% |
| Interquartile Range (IQR) | 4.2% | 6.3% |
| Standard Deviation (Sample) | 3.8% | 7.0% |
| Standard Deviation (Population) | 3.8% | 6.9% |
Similar Demographics by 9th Grade
Demographics Similar to Cubans by 9th Grade
In terms of 9th grade, the demographic groups most similar to Cubans are Sri Lankan (93.2%, a difference of 0.0%), Immigrants from Laos (93.2%, a difference of 0.020%), Immigrants from Burma/Myanmar (93.1%, a difference of 0.020%), Indonesian (93.1%, a difference of 0.020%), and British West Indian (93.2%, a difference of 0.030%).
| Demographics | Rating | Rank | 9th Grade |
| Immigrants | St. Vincent and the Grenadines | 0.0 /100 | #287 | Tragic 93.4% |
| Immigrants | South Eastern Asia | 0.0 /100 | #288 | Tragic 93.3% |
| Immigrants | West Indies | 0.0 /100 | #289 | Tragic 93.3% |
| Pennsylvania Germans | 0.0 /100 | #290 | Tragic 93.3% |
| British West Indians | 0.0 /100 | #291 | Tragic 93.2% |
| Immigrants | Laos | 0.0 /100 | #292 | Tragic 93.2% |
| Sri Lankans | 0.0 /100 | #293 | Tragic 93.2% |
| Cubans | 0.0 /100 | #294 | Tragic 93.2% |
| Immigrants | Burma/Myanmar | 0.0 /100 | #295 | Tragic 93.1% |
| Indonesians | 0.0 /100 | #296 | Tragic 93.1% |
| Fijians | 0.0 /100 | #297 | Tragic 93.1% |
| Haitians | 0.0 /100 | #298 | Tragic 93.1% |
| Immigrants | Grenada | 0.0 /100 | #299 | Tragic 93.0% |
| Yaqui | 0.0 /100 | #300 | Tragic 92.9% |
| Immigrants | Haiti | 0.0 /100 | #301 | Tragic 92.7% |
Demographics Similar to Immigrants from Honduras by 9th Grade
In terms of 9th grade, the demographic groups most similar to Immigrants from Honduras are Immigrants from Dominican Republic (90.5%, a difference of 0.14%), Immigrants from the Azores (90.8%, a difference of 0.17%), Immigrants from Yemen (90.8%, a difference of 0.22%), Immigrants from Latin America (90.4%, a difference of 0.25%), and Central American (90.4%, a difference of 0.26%).
| Demographics | Rating | Rank | 9th Grade |
| Dominicans | 0.0 /100 | #328 | Tragic 91.1% |
| Hondurans | 0.0 /100 | #329 | Tragic 91.0% |
| Immigrants | Cabo Verde | 0.0 /100 | #330 | Tragic 90.9% |
| Mexican American Indians | 0.0 /100 | #331 | Tragic 90.9% |
| Hispanics or Latinos | 0.0 /100 | #332 | Tragic 90.9% |
| Immigrants | Yemen | 0.0 /100 | #333 | Tragic 90.8% |
| Immigrants | Azores | 0.0 /100 | #334 | Tragic 90.8% |
| Immigrants | Honduras | 0.0 /100 | #335 | Tragic 90.6% |
| Immigrants | Dominican Republic | 0.0 /100 | #336 | Tragic 90.5% |
| Immigrants | Latin America | 0.0 /100 | #337 | Tragic 90.4% |
| Central Americans | 0.0 /100 | #338 | Tragic 90.4% |
| Yakama | 0.0 /100 | #339 | Tragic 90.1% |
| Mexicans | 0.0 /100 | #340 | Tragic 90.0% |
| Guatemalans | 0.0 /100 | #341 | Tragic 89.9% |
| Salvadorans | 0.0 /100 | #342 | Tragic 89.6% |