Bangladeshi vs Immigrants from Honduras 9th Grade
COMPARE
Bangladeshi
Immigrants from Honduras
9th Grade
9th Grade Comparison
Bangladeshis
Immigrants from Honduras
93.4%
9TH GRADE
0.0/ 100
METRIC RATING
284th/ 347
METRIC RANK
90.6%
9TH GRADE
0.0/ 100
METRIC RATING
335th/ 347
METRIC RANK
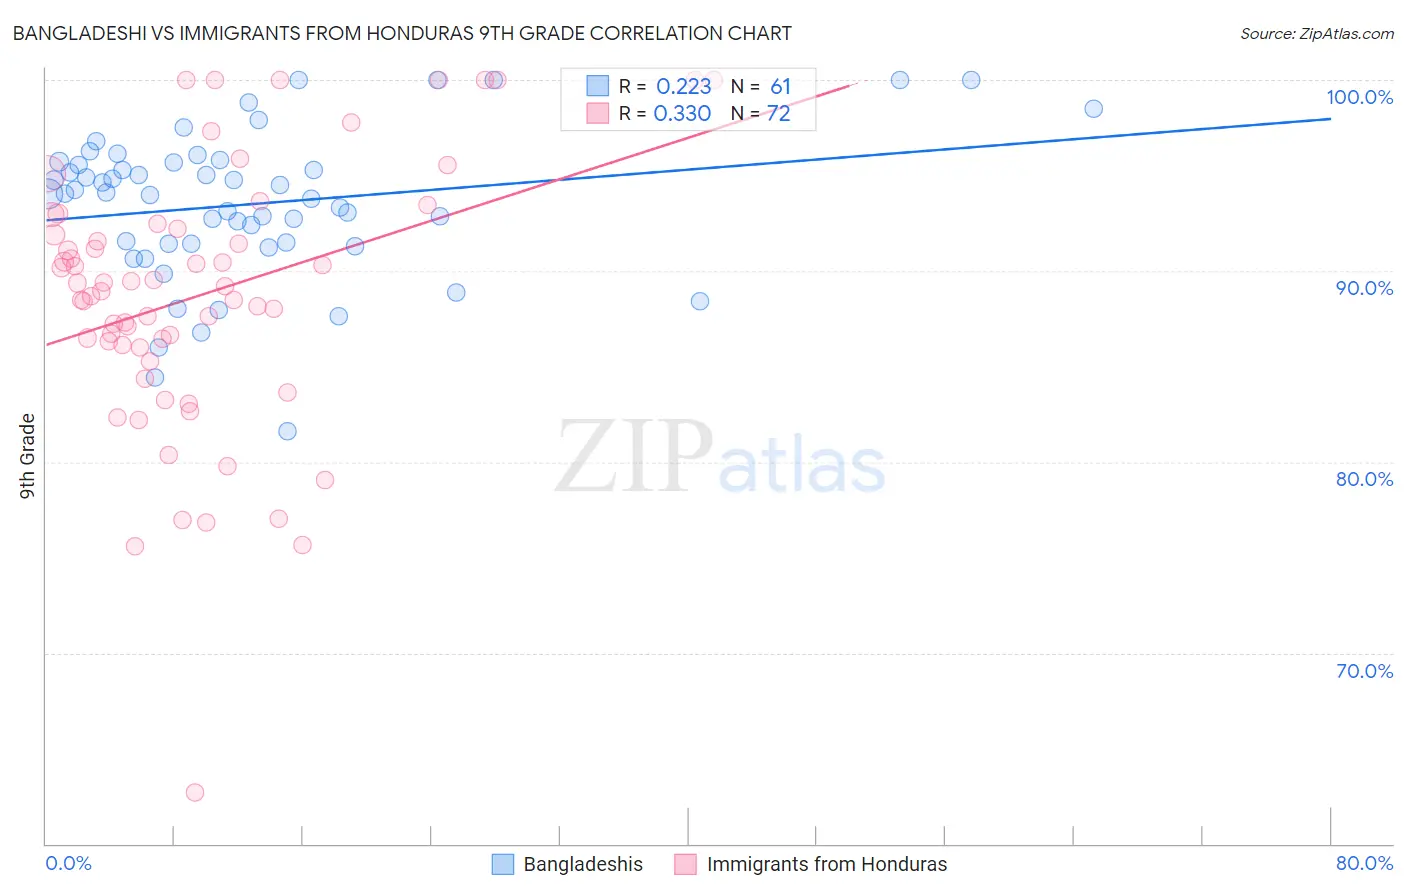
Bangladeshi vs Immigrants from Honduras 9th Grade Correlation Chart
The statistical analysis conducted on geographies consisting of 141,430,495 people shows a weak positive correlation between the proportion of Bangladeshis and percentage of population with at least 9th grade education in the United States with a correlation coefficient (R) of 0.223 and weighted average of 93.4%. Similarly, the statistical analysis conducted on geographies consisting of 322,637,445 people shows a mild positive correlation between the proportion of Immigrants from Honduras and percentage of population with at least 9th grade education in the United States with a correlation coefficient (R) of 0.330 and weighted average of 90.6%, a difference of 3.1%.
9th Grade Correlation Summary
| Measurement | Bangladeshi | Immigrants from Honduras |
| Minimum | 81.6% | 62.7% |
| Maximum | 100.0% | 100.0% |
| Range | 18.4% | 37.3% |
| Mean | 93.5% | 88.7% |
| Median | 94.1% | 89.1% |
| Interquartile 25% (IQ1) | 91.4% | 86.1% |
| Interquartile 75% (IQ3) | 95.7% | 92.3% |
| Interquartile Range (IQR) | 4.3% | 6.3% |
| Standard Deviation (Sample) | 3.9% | 7.0% |
| Standard Deviation (Population) | 3.8% | 6.9% |
Similar Demographics by 9th Grade
Demographics Similar to Bangladeshis by 9th Grade
In terms of 9th grade, the demographic groups most similar to Bangladeshis are Immigrants from Peru (93.4%, a difference of 0.040%), Barbadian (93.5%, a difference of 0.070%), Malaysian (93.5%, a difference of 0.080%), Immigrants from Barbados (93.4%, a difference of 0.080%), and Immigrants from St. Vincent and the Grenadines (93.4%, a difference of 0.090%).
| Demographics | Rating | Rank | 9th Grade |
| Immigrants | Philippines | 0.1 /100 | #277 | Tragic 93.7% |
| Immigrants | Eritrea | 0.1 /100 | #278 | Tragic 93.7% |
| Trinidadians and Tobagonians | 0.1 /100 | #279 | Tragic 93.7% |
| Taiwanese | 0.1 /100 | #280 | Tragic 93.6% |
| Immigrants | Trinidad and Tobago | 0.1 /100 | #281 | Tragic 93.6% |
| Malaysians | 0.0 /100 | #282 | Tragic 93.5% |
| Barbadians | 0.0 /100 | #283 | Tragic 93.5% |
| Bangladeshis | 0.0 /100 | #284 | Tragic 93.4% |
| Immigrants | Peru | 0.0 /100 | #285 | Tragic 93.4% |
| Immigrants | Barbados | 0.0 /100 | #286 | Tragic 93.4% |
| Immigrants | St. Vincent and the Grenadines | 0.0 /100 | #287 | Tragic 93.4% |
| Immigrants | South Eastern Asia | 0.0 /100 | #288 | Tragic 93.3% |
| Immigrants | West Indies | 0.0 /100 | #289 | Tragic 93.3% |
| Pennsylvania Germans | 0.0 /100 | #290 | Tragic 93.3% |
| British West Indians | 0.0 /100 | #291 | Tragic 93.2% |
Demographics Similar to Immigrants from Honduras by 9th Grade
In terms of 9th grade, the demographic groups most similar to Immigrants from Honduras are Immigrants from Dominican Republic (90.5%, a difference of 0.14%), Immigrants from the Azores (90.8%, a difference of 0.17%), Immigrants from Yemen (90.8%, a difference of 0.22%), Immigrants from Latin America (90.4%, a difference of 0.25%), and Central American (90.4%, a difference of 0.26%).
| Demographics | Rating | Rank | 9th Grade |
| Dominicans | 0.0 /100 | #328 | Tragic 91.1% |
| Hondurans | 0.0 /100 | #329 | Tragic 91.0% |
| Immigrants | Cabo Verde | 0.0 /100 | #330 | Tragic 90.9% |
| Mexican American Indians | 0.0 /100 | #331 | Tragic 90.9% |
| Hispanics or Latinos | 0.0 /100 | #332 | Tragic 90.9% |
| Immigrants | Yemen | 0.0 /100 | #333 | Tragic 90.8% |
| Immigrants | Azores | 0.0 /100 | #334 | Tragic 90.8% |
| Immigrants | Honduras | 0.0 /100 | #335 | Tragic 90.6% |
| Immigrants | Dominican Republic | 0.0 /100 | #336 | Tragic 90.5% |
| Immigrants | Latin America | 0.0 /100 | #337 | Tragic 90.4% |
| Central Americans | 0.0 /100 | #338 | Tragic 90.4% |
| Yakama | 0.0 /100 | #339 | Tragic 90.1% |
| Mexicans | 0.0 /100 | #340 | Tragic 90.0% |
| Guatemalans | 0.0 /100 | #341 | Tragic 89.9% |
| Salvadorans | 0.0 /100 | #342 | Tragic 89.6% |