Immigrants from Africa vs Immigrants from Senegal 6th Grade
COMPARE
Immigrants from Africa
Immigrants from Senegal
6th Grade
6th Grade Comparison
Immigrants from Africa
Immigrants from Senegal
96.6%
6TH GRADE
1.3/ 100
METRIC RATING
246th/ 347
METRIC RANK
96.5%
6TH GRADE
0.7/ 100
METRIC RATING
251st/ 347
METRIC RANK
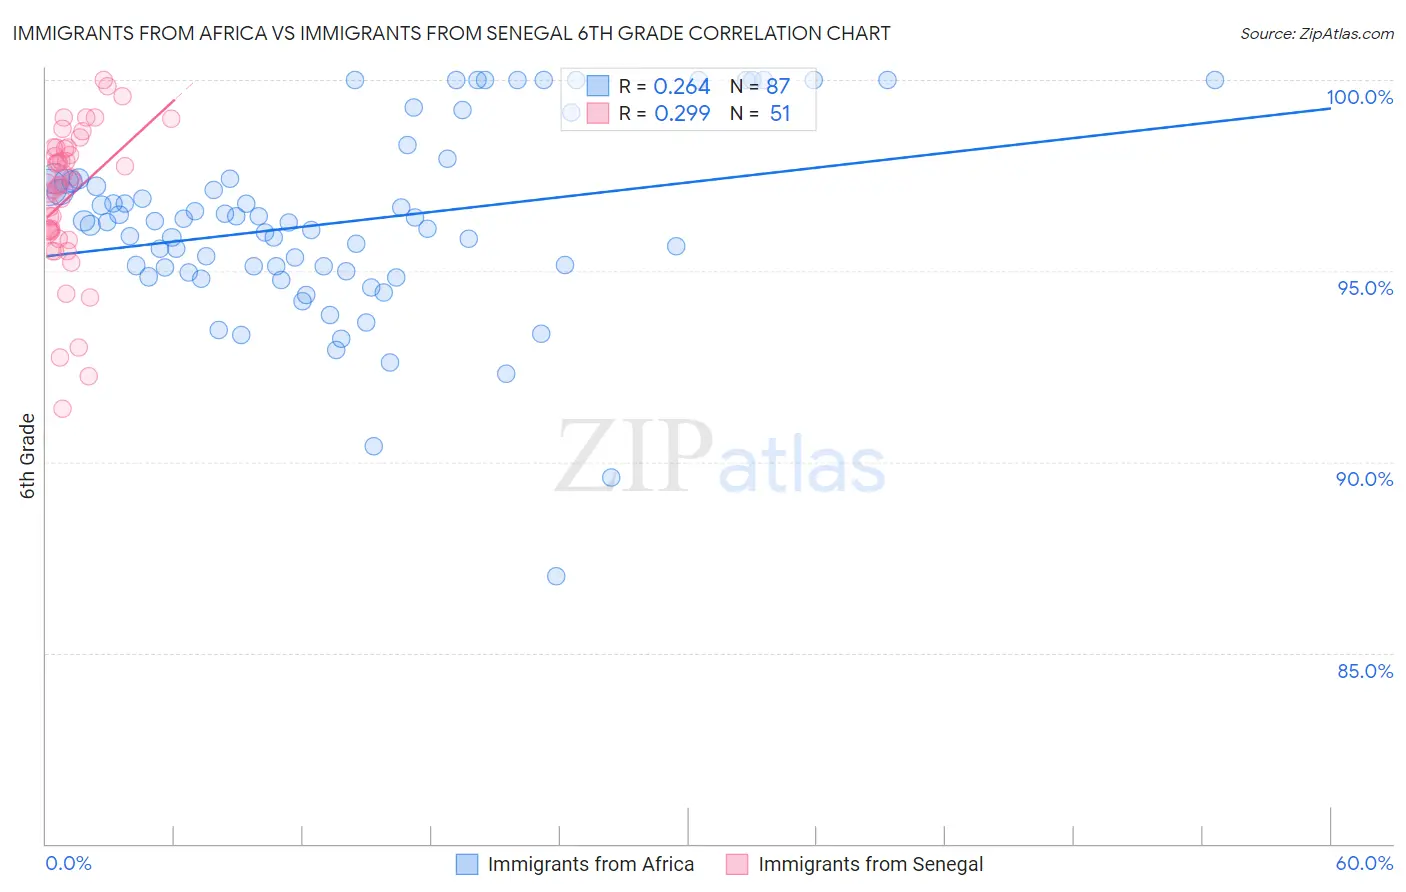
Immigrants from Africa vs Immigrants from Senegal 6th Grade Correlation Chart
The statistical analysis conducted on geographies consisting of 469,381,733 people shows a weak positive correlation between the proportion of Immigrants from Africa and percentage of population with at least 6th grade education in the United States with a correlation coefficient (R) of 0.264 and weighted average of 96.6%. Similarly, the statistical analysis conducted on geographies consisting of 90,119,306 people shows a weak positive correlation between the proportion of Immigrants from Senegal and percentage of population with at least 6th grade education in the United States with a correlation coefficient (R) of 0.299 and weighted average of 96.5%, a difference of 0.080%.
6th Grade Correlation Summary
| Measurement | Immigrants from Africa | Immigrants from Senegal |
| Minimum | 87.0% | 91.4% |
| Maximum | 100.0% | 100.0% |
| Range | 13.0% | 8.6% |
| Mean | 96.3% | 96.9% |
| Median | 96.3% | 97.3% |
| Interquartile 25% (IQ1) | 95.0% | 96.0% |
| Interquartile 75% (IQ3) | 97.4% | 98.2% |
| Interquartile Range (IQR) | 2.4% | 2.2% |
| Standard Deviation (Sample) | 2.5% | 1.9% |
| Standard Deviation (Population) | 2.5% | 1.9% |
Demographics Similar to Immigrants from Africa and Immigrants from Senegal by 6th Grade
In terms of 6th grade, the demographic groups most similar to Immigrants from Africa are Immigrants from Costa Rica (96.6%, a difference of 0.0%), Ethiopian (96.6%, a difference of 0.020%), Immigrants from Liberia (96.6%, a difference of 0.030%), Bolivian (96.5%, a difference of 0.030%), and Indian (Asian) (96.6%, a difference of 0.040%). Similarly, the demographic groups most similar to Immigrants from Senegal are Immigrants from Uruguay (96.5%, a difference of 0.010%), Jamaican (96.5%, a difference of 0.010%), Immigrants from Middle Africa (96.5%, a difference of 0.020%), Immigrants from Ethiopia (96.5%, a difference of 0.020%), and Immigrants from Congo (96.5%, a difference of 0.020%).
| Demographics | Rating | Rank | 6th Grade |
| Nigerians | 1.9 /100 | #238 | Tragic 96.6% |
| Indians (Asian) | 1.9 /100 | #239 | Tragic 96.6% |
| Koreans | 1.9 /100 | #240 | Tragic 96.6% |
| Senegalese | 1.8 /100 | #241 | Tragic 96.6% |
| Immigrants | Asia | 1.8 /100 | #242 | Tragic 96.6% |
| Immigrants | Liberia | 1.6 /100 | #243 | Tragic 96.6% |
| Ethiopians | 1.5 /100 | #244 | Tragic 96.6% |
| Immigrants | Costa Rica | 1.3 /100 | #245 | Tragic 96.6% |
| Immigrants | Africa | 1.3 /100 | #246 | Tragic 96.6% |
| Bolivians | 1.0 /100 | #247 | Tragic 96.5% |
| Tohono O'odham | 1.0 /100 | #248 | Tragic 96.5% |
| Colombians | 0.9 /100 | #249 | Tragic 96.5% |
| Immigrants | Middle Africa | 0.8 /100 | #250 | Tragic 96.5% |
| Immigrants | Senegal | 0.7 /100 | #251 | Tragic 96.5% |
| Immigrants | Uruguay | 0.6 /100 | #252 | Tragic 96.5% |
| Jamaicans | 0.6 /100 | #253 | Tragic 96.5% |
| Immigrants | Ethiopia | 0.6 /100 | #254 | Tragic 96.5% |
| Immigrants | Congo | 0.6 /100 | #255 | Tragic 96.5% |
| U.S. Virgin Islanders | 0.5 /100 | #256 | Tragic 96.5% |
| Taiwanese | 0.5 /100 | #257 | Tragic 96.5% |
| Immigrants | China | 0.4 /100 | #258 | Tragic 96.4% |