Russian vs Navajo 6th Grade
COMPARE
Russian
Navajo
6th Grade
6th Grade Comparison
Russians
Navajo
97.7%
6TH GRADE
99.7/ 100
METRIC RATING
63rd/ 347
METRIC RANK
96.8%
6TH GRADE
7.3/ 100
METRIC RATING
218th/ 347
METRIC RANK
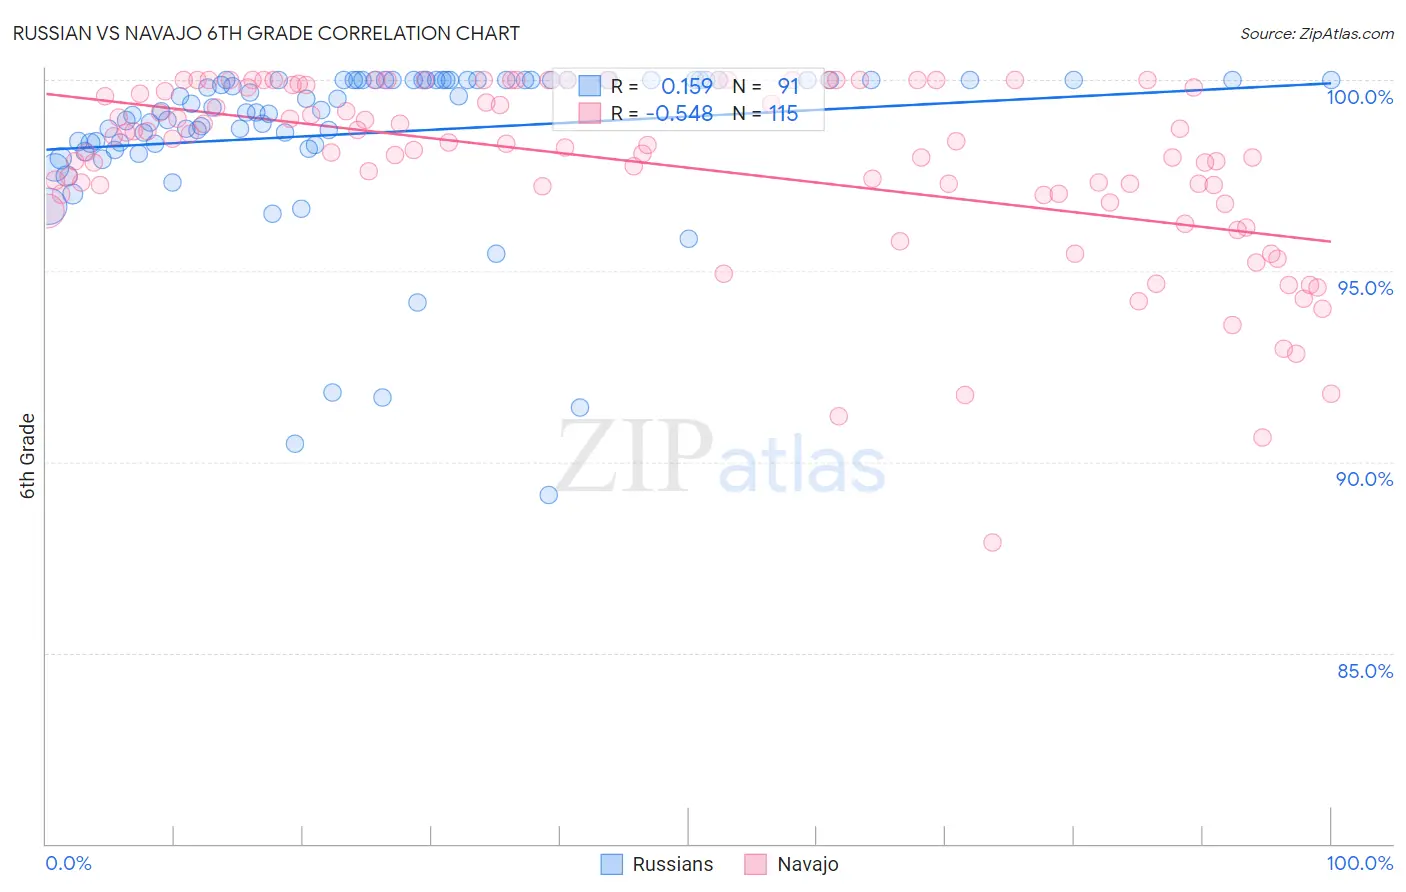
Russian vs Navajo 6th Grade Correlation Chart
The statistical analysis conducted on geographies consisting of 512,259,047 people shows a poor positive correlation between the proportion of Russians and percentage of population with at least 6th grade education in the United States with a correlation coefficient (R) of 0.159 and weighted average of 97.7%. Similarly, the statistical analysis conducted on geographies consisting of 224,872,927 people shows a substantial negative correlation between the proportion of Navajo and percentage of population with at least 6th grade education in the United States with a correlation coefficient (R) of -0.548 and weighted average of 96.8%, a difference of 0.95%.
6th Grade Correlation Summary
| Measurement | Russian | Navajo |
| Minimum | 89.1% | 87.9% |
| Maximum | 100.0% | 100.0% |
| Range | 10.9% | 12.1% |
| Mean | 98.6% | 97.8% |
| Median | 99.3% | 98.3% |
| Interquartile 25% (IQ1) | 98.3% | 97.0% |
| Interquartile 75% (IQ3) | 100.0% | 99.9% |
| Interquartile Range (IQR) | 1.7% | 2.9% |
| Standard Deviation (Sample) | 2.2% | 2.4% |
| Standard Deviation (Population) | 2.2% | 2.4% |
Similar Demographics by 6th Grade
Demographics Similar to Russians by 6th Grade
In terms of 6th grade, the demographic groups most similar to Russians are Immigrants from North America (97.7%, a difference of 0.010%), Canadian (97.7%, a difference of 0.010%), Immigrants from Canada (97.7%, a difference of 0.020%), Serbian (97.7%, a difference of 0.020%), and Immigrants from Northern Europe (97.7%, a difference of 0.020%).
| Demographics | Rating | Rank | 6th Grade |
| Austrians | 99.8 /100 | #56 | Exceptional 97.7% |
| Whites/Caucasians | 99.8 /100 | #57 | Exceptional 97.7% |
| Greeks | 99.8 /100 | #58 | Exceptional 97.7% |
| Americans | 99.8 /100 | #59 | Exceptional 97.7% |
| Immigrants | Canada | 99.8 /100 | #60 | Exceptional 97.7% |
| Serbians | 99.7 /100 | #61 | Exceptional 97.7% |
| Immigrants | North America | 99.7 /100 | #62 | Exceptional 97.7% |
| Russians | 99.7 /100 | #63 | Exceptional 97.7% |
| Canadians | 99.7 /100 | #64 | Exceptional 97.7% |
| Immigrants | Northern Europe | 99.6 /100 | #65 | Exceptional 97.7% |
| New Zealanders | 99.6 /100 | #66 | Exceptional 97.7% |
| Kiowa | 99.6 /100 | #67 | Exceptional 97.7% |
| Immigrants | Austria | 99.6 /100 | #68 | Exceptional 97.7% |
| Iranians | 99.6 /100 | #69 | Exceptional 97.6% |
| Cajuns | 99.5 /100 | #70 | Exceptional 97.6% |
Demographics Similar to Navajo by 6th Grade
In terms of 6th grade, the demographic groups most similar to Navajo are Liberian (96.8%, a difference of 0.0%), Sierra Leonean (96.8%, a difference of 0.010%), Paiute (96.8%, a difference of 0.010%), Costa Rican (96.8%, a difference of 0.010%), and Immigrants from Sudan (96.8%, a difference of 0.020%).
| Demographics | Rating | Rank | 6th Grade |
| Immigrants | Iraq | 9.2 /100 | #211 | Tragic 96.8% |
| Moroccans | 9.0 /100 | #212 | Tragic 96.8% |
| Immigrants | Sudan | 8.7 /100 | #213 | Tragic 96.8% |
| Portuguese | 8.2 /100 | #214 | Tragic 96.8% |
| Sierra Leoneans | 8.0 /100 | #215 | Tragic 96.8% |
| Paiute | 7.8 /100 | #216 | Tragic 96.8% |
| Liberians | 7.5 /100 | #217 | Tragic 96.8% |
| Navajo | 7.3 /100 | #218 | Tragic 96.8% |
| Costa Ricans | 6.8 /100 | #219 | Tragic 96.8% |
| Immigrants | Morocco | 6.2 /100 | #220 | Tragic 96.7% |
| Tongans | 6.1 /100 | #221 | Tragic 96.7% |
| Immigrants | Syria | 5.9 /100 | #222 | Tragic 96.7% |
| Bahamians | 4.8 /100 | #223 | Tragic 96.7% |
| Immigrants | Southern Europe | 4.4 /100 | #224 | Tragic 96.7% |
| Immigrants | Pakistan | 4.4 /100 | #225 | Tragic 96.7% |