Russian vs Panamanian 7th Grade
COMPARE
Russian
Panamanian
7th Grade
7th Grade Comparison
Russians
Panamanians
97.0%
7TH GRADE
99.8/ 100
METRIC RATING
55th/ 347
METRIC RANK
95.9%
7TH GRADE
32.3/ 100
METRIC RATING
192nd/ 347
METRIC RANK
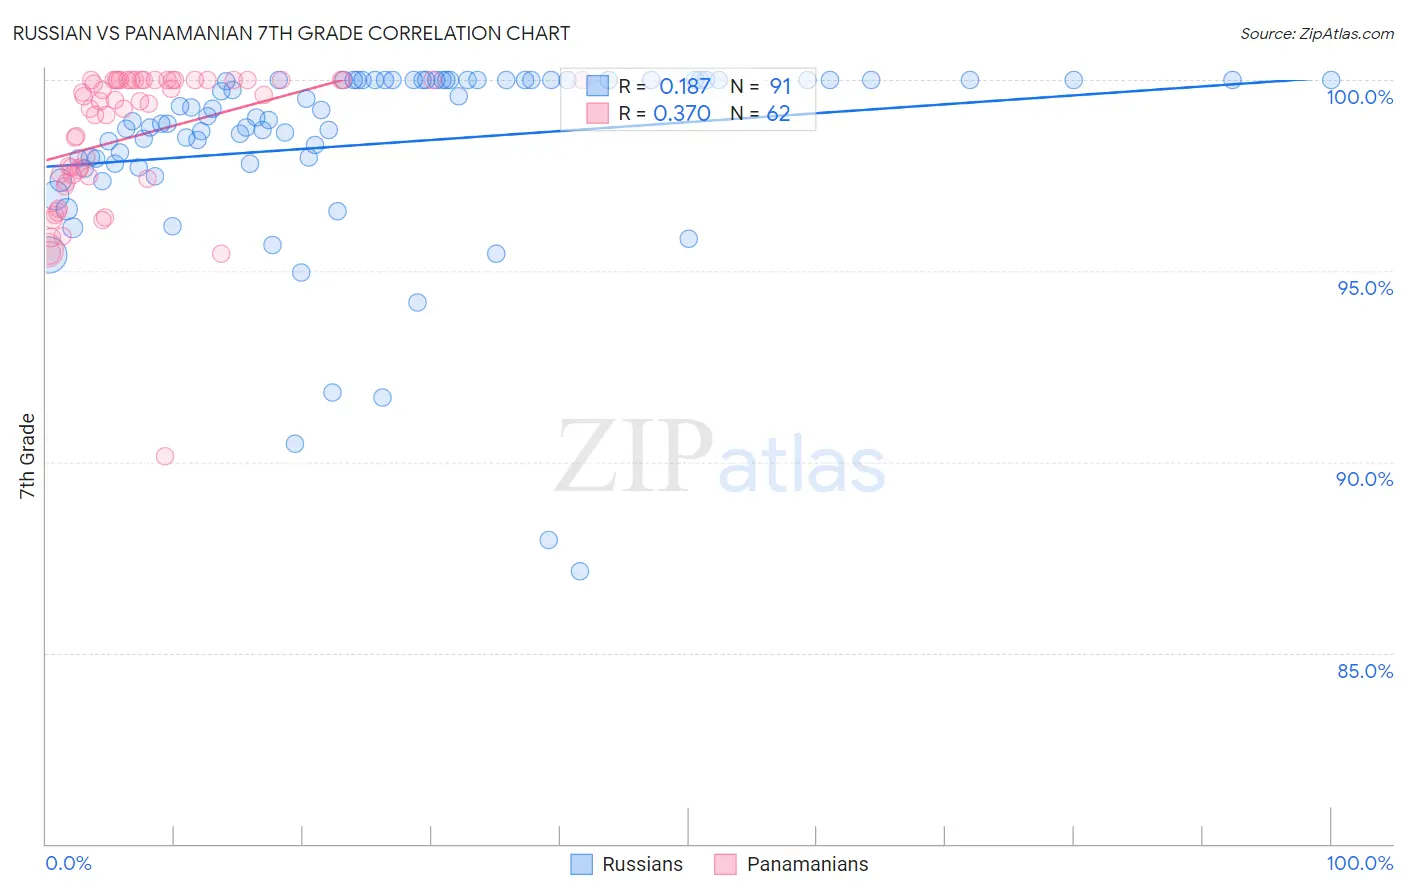
Russian vs Panamanian 7th Grade Correlation Chart
The statistical analysis conducted on geographies consisting of 512,259,047 people shows a poor positive correlation between the proportion of Russians and percentage of population with at least 7th grade education in the United States with a correlation coefficient (R) of 0.187 and weighted average of 97.0%. Similarly, the statistical analysis conducted on geographies consisting of 281,248,945 people shows a mild positive correlation between the proportion of Panamanians and percentage of population with at least 7th grade education in the United States with a correlation coefficient (R) of 0.370 and weighted average of 95.9%, a difference of 1.1%.
7th Grade Correlation Summary
| Measurement | Russian | Panamanian |
| Minimum | 87.1% | 90.1% |
| Maximum | 100.0% | 100.0% |
| Range | 12.9% | 9.9% |
| Mean | 98.3% | 98.5% |
| Median | 99.0% | 99.5% |
| Interquartile 25% (IQ1) | 97.8% | 97.5% |
| Interquartile 75% (IQ3) | 100.0% | 100.0% |
| Interquartile Range (IQR) | 2.2% | 2.5% |
| Standard Deviation (Sample) | 2.5% | 1.9% |
| Standard Deviation (Population) | 2.5% | 1.8% |
Similar Demographics by 7th Grade
Demographics Similar to Russians by 7th Grade
In terms of 7th grade, the demographic groups most similar to Russians are Serbian (97.0%, a difference of 0.0%), American (97.0%, a difference of 0.0%), Australian (97.0%, a difference of 0.010%), White/Caucasian (97.0%, a difference of 0.020%), and Macedonian (97.0%, a difference of 0.020%).
| Demographics | Rating | Rank | 7th Grade |
| Celtics | 99.9 /100 | #48 | Exceptional 97.1% |
| Slavs | 99.9 /100 | #49 | Exceptional 97.1% |
| Immigrants | Scotland | 99.9 /100 | #50 | Exceptional 97.1% |
| Estonians | 99.9 /100 | #51 | Exceptional 97.0% |
| Greeks | 99.9 /100 | #52 | Exceptional 97.0% |
| Austrians | 99.8 /100 | #53 | Exceptional 97.0% |
| Australians | 99.8 /100 | #54 | Exceptional 97.0% |
| Russians | 99.8 /100 | #55 | Exceptional 97.0% |
| Serbians | 99.8 /100 | #56 | Exceptional 97.0% |
| Americans | 99.8 /100 | #57 | Exceptional 97.0% |
| Whites/Caucasians | 99.8 /100 | #58 | Exceptional 97.0% |
| Macedonians | 99.8 /100 | #59 | Exceptional 97.0% |
| Immigrants | Canada | 99.8 /100 | #60 | Exceptional 96.9% |
| Creek | 99.8 /100 | #61 | Exceptional 96.9% |
| Immigrants | North America | 99.8 /100 | #62 | Exceptional 96.9% |
Demographics Similar to Panamanians by 7th Grade
In terms of 7th grade, the demographic groups most similar to Panamanians are Immigrants from Micronesia (95.9%, a difference of 0.0%), Liberian (95.9%, a difference of 0.0%), Immigrants from Egypt (95.9%, a difference of 0.010%), Immigrants from Venezuela (95.9%, a difference of 0.010%), and Immigrants from Bahamas (95.9%, a difference of 0.010%).
| Demographics | Rating | Rank | 7th Grade |
| Brazilians | 37.3 /100 | #185 | Fair 96.0% |
| Immigrants | Iraq | 36.1 /100 | #186 | Fair 96.0% |
| Immigrants | Uganda | 36.0 /100 | #187 | Fair 96.0% |
| Immigrants | Egypt | 34.3 /100 | #188 | Fair 95.9% |
| Immigrants | Venezuela | 33.9 /100 | #189 | Fair 95.9% |
| Immigrants | Micronesia | 32.6 /100 | #190 | Fair 95.9% |
| Liberians | 32.5 /100 | #191 | Fair 95.9% |
| Panamanians | 32.3 /100 | #192 | Fair 95.9% |
| Immigrants | Bahamas | 30.8 /100 | #193 | Fair 95.9% |
| Immigrants | Nepal | 30.0 /100 | #194 | Fair 95.9% |
| Sudanese | 28.1 /100 | #195 | Fair 95.9% |
| Apache | 27.6 /100 | #196 | Fair 95.9% |
| Immigrants | Zaire | 26.7 /100 | #197 | Fair 95.9% |
| Paraguayans | 24.8 /100 | #198 | Fair 95.9% |
| Guamanians/Chamorros | 23.5 /100 | #199 | Fair 95.9% |