Russian vs Spanish 9th Grade
COMPARE
Russian
Spanish
9th Grade
9th Grade Comparison
Russians
Spanish
96.0%
9TH GRADE
99.9/ 100
METRIC RATING
47th/ 347
METRIC RANK
95.2%
9TH GRADE
84.4/ 100
METRIC RATING
143rd/ 347
METRIC RANK
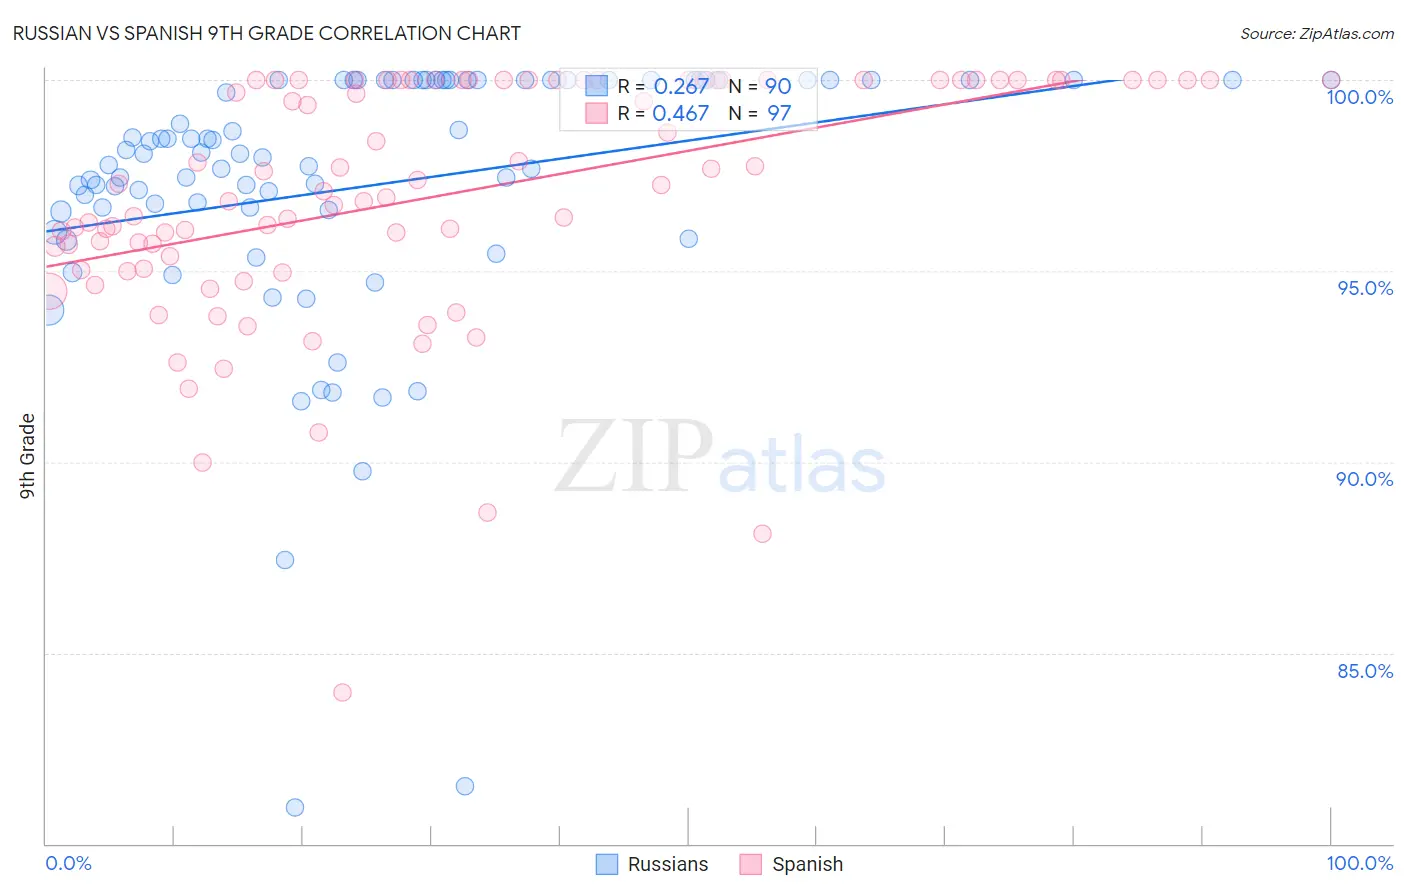
Russian vs Spanish 9th Grade Correlation Chart
The statistical analysis conducted on geographies consisting of 512,258,066 people shows a weak positive correlation between the proportion of Russians and percentage of population with at least 9th grade education in the United States with a correlation coefficient (R) of 0.267 and weighted average of 96.0%. Similarly, the statistical analysis conducted on geographies consisting of 422,188,828 people shows a moderate positive correlation between the proportion of Spanish and percentage of population with at least 9th grade education in the United States with a correlation coefficient (R) of 0.467 and weighted average of 95.2%, a difference of 0.93%.
9th Grade Correlation Summary
| Measurement | Russian | Spanish |
| Minimum | 81.0% | 84.0% |
| Maximum | 100.0% | 100.0% |
| Range | 19.0% | 16.0% |
| Mean | 97.2% | 97.0% |
| Median | 98.1% | 97.3% |
| Interquartile 25% (IQ1) | 96.6% | 95.2% |
| Interquartile 75% (IQ3) | 100.0% | 100.0% |
| Interquartile Range (IQR) | 3.4% | 4.8% |
| Standard Deviation (Sample) | 3.6% | 3.2% |
| Standard Deviation (Population) | 3.6% | 3.2% |
Similar Demographics by 9th Grade
Demographics Similar to Russians by 9th Grade
In terms of 9th grade, the demographic groups most similar to Russians are Australian (96.0%, a difference of 0.0%), Crow (96.1%, a difference of 0.010%), Immigrants from India (96.1%, a difference of 0.010%), Greek (96.0%, a difference of 0.010%), and Alaska Native (96.1%, a difference of 0.020%).
| Demographics | Rating | Rank | 9th Grade |
| Slavs | 99.9 /100 | #40 | Exceptional 96.1% |
| Czechoslovakians | 99.9 /100 | #41 | Exceptional 96.1% |
| Chippewa | 99.9 /100 | #42 | Exceptional 96.1% |
| Iranians | 99.9 /100 | #43 | Exceptional 96.1% |
| Alaska Natives | 99.9 /100 | #44 | Exceptional 96.1% |
| Crow | 99.9 /100 | #45 | Exceptional 96.1% |
| Immigrants | India | 99.9 /100 | #46 | Exceptional 96.1% |
| Russians | 99.9 /100 | #47 | Exceptional 96.0% |
| Australians | 99.9 /100 | #48 | Exceptional 96.0% |
| Greeks | 99.9 /100 | #49 | Exceptional 96.0% |
| Celtics | 99.9 /100 | #50 | Exceptional 96.0% |
| Immigrants | Northern Europe | 99.9 /100 | #51 | Exceptional 96.0% |
| Serbians | 99.9 /100 | #52 | Exceptional 96.0% |
| Austrians | 99.8 /100 | #53 | Exceptional 96.0% |
| Immigrants | Canada | 99.8 /100 | #54 | Exceptional 96.0% |
Demographics Similar to Spanish by 9th Grade
In terms of 9th grade, the demographic groups most similar to Spanish are Immigrants from Greece (95.2%, a difference of 0.0%), Immigrants from Taiwan (95.2%, a difference of 0.010%), Immigrants from Bosnia and Herzegovina (95.2%, a difference of 0.010%), Yup'ik (95.2%, a difference of 0.010%), and Immigrants from Eastern Europe (95.2%, a difference of 0.020%).
| Demographics | Rating | Rank | 9th Grade |
| Immigrants | Iran | 88.3 /100 | #136 | Excellent 95.2% |
| Hmong | 87.7 /100 | #137 | Excellent 95.2% |
| Immigrants | Russia | 86.6 /100 | #138 | Excellent 95.2% |
| Immigrants | Eastern Europe | 85.8 /100 | #139 | Excellent 95.2% |
| Immigrants | Taiwan | 85.3 /100 | #140 | Excellent 95.2% |
| Immigrants | Bosnia and Herzegovina | 85.2 /100 | #141 | Excellent 95.2% |
| Immigrants | Greece | 84.6 /100 | #142 | Excellent 95.2% |
| Spanish | 84.4 /100 | #143 | Excellent 95.2% |
| Yup'ik | 83.3 /100 | #144 | Excellent 95.2% |
| Pueblo | 82.2 /100 | #145 | Excellent 95.1% |
| Immigrants | Sri Lanka | 82.1 /100 | #146 | Excellent 95.1% |
| Choctaw | 81.9 /100 | #147 | Excellent 95.1% |
| Immigrants | Jordan | 81.2 /100 | #148 | Excellent 95.1% |
| Immigrants | Korea | 79.6 /100 | #149 | Good 95.1% |
| Kenyans | 79.1 /100 | #150 | Good 95.1% |