Russian vs Immigrants from Armenia 9th Grade
COMPARE
Russian
Immigrants from Armenia
9th Grade
9th Grade Comparison
Russians
Immigrants from Armenia
96.0%
9TH GRADE
99.9/ 100
METRIC RATING
47th/ 347
METRIC RANK
91.4%
9TH GRADE
0.0/ 100
METRIC RATING
326th/ 347
METRIC RANK
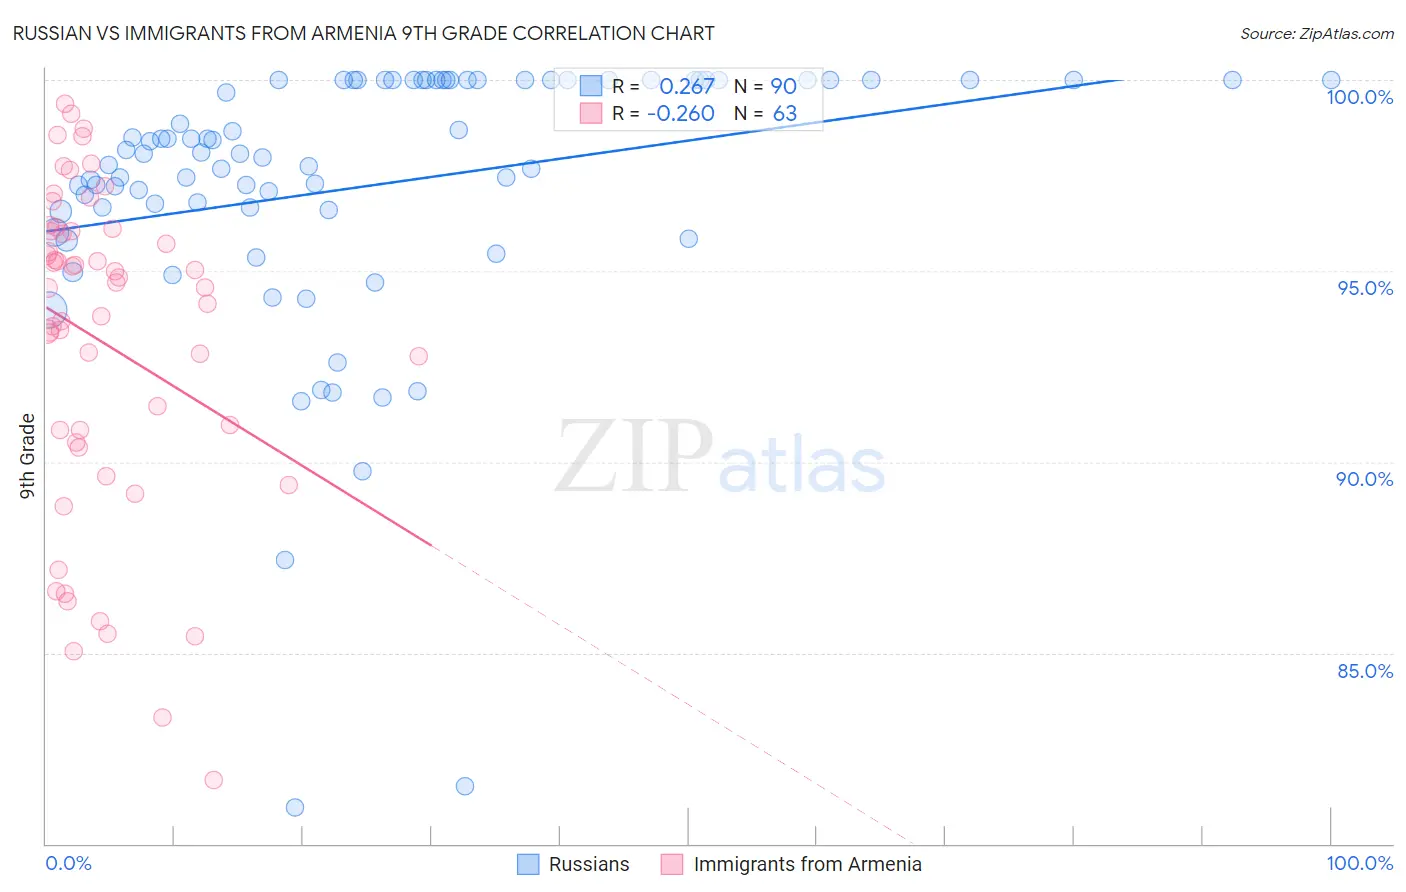
Russian vs Immigrants from Armenia 9th Grade Correlation Chart
The statistical analysis conducted on geographies consisting of 512,258,066 people shows a weak positive correlation between the proportion of Russians and percentage of population with at least 9th grade education in the United States with a correlation coefficient (R) of 0.267 and weighted average of 96.0%. Similarly, the statistical analysis conducted on geographies consisting of 97,657,339 people shows a weak negative correlation between the proportion of Immigrants from Armenia and percentage of population with at least 9th grade education in the United States with a correlation coefficient (R) of -0.260 and weighted average of 91.4%, a difference of 5.1%.
9th Grade Correlation Summary
| Measurement | Russian | Immigrants from Armenia |
| Minimum | 81.0% | 81.7% |
| Maximum | 100.0% | 99.4% |
| Range | 19.0% | 17.7% |
| Mean | 97.2% | 93.1% |
| Median | 98.1% | 94.6% |
| Interquartile 25% (IQ1) | 96.6% | 90.5% |
| Interquartile 75% (IQ3) | 100.0% | 96.0% |
| Interquartile Range (IQR) | 3.4% | 5.5% |
| Standard Deviation (Sample) | 3.6% | 4.3% |
| Standard Deviation (Population) | 3.6% | 4.2% |
Similar Demographics by 9th Grade
Demographics Similar to Russians by 9th Grade
In terms of 9th grade, the demographic groups most similar to Russians are Australian (96.0%, a difference of 0.0%), Crow (96.1%, a difference of 0.010%), Immigrants from India (96.1%, a difference of 0.010%), Greek (96.0%, a difference of 0.010%), and Alaska Native (96.1%, a difference of 0.020%).
| Demographics | Rating | Rank | 9th Grade |
| Slavs | 99.9 /100 | #40 | Exceptional 96.1% |
| Czechoslovakians | 99.9 /100 | #41 | Exceptional 96.1% |
| Chippewa | 99.9 /100 | #42 | Exceptional 96.1% |
| Iranians | 99.9 /100 | #43 | Exceptional 96.1% |
| Alaska Natives | 99.9 /100 | #44 | Exceptional 96.1% |
| Crow | 99.9 /100 | #45 | Exceptional 96.1% |
| Immigrants | India | 99.9 /100 | #46 | Exceptional 96.1% |
| Russians | 99.9 /100 | #47 | Exceptional 96.0% |
| Australians | 99.9 /100 | #48 | Exceptional 96.0% |
| Greeks | 99.9 /100 | #49 | Exceptional 96.0% |
| Celtics | 99.9 /100 | #50 | Exceptional 96.0% |
| Immigrants | Northern Europe | 99.9 /100 | #51 | Exceptional 96.0% |
| Serbians | 99.9 /100 | #52 | Exceptional 96.0% |
| Austrians | 99.8 /100 | #53 | Exceptional 96.0% |
| Immigrants | Canada | 99.8 /100 | #54 | Exceptional 96.0% |
Demographics Similar to Immigrants from Armenia by 9th Grade
In terms of 9th grade, the demographic groups most similar to Immigrants from Armenia are Immigrants from Nicaragua (91.3%, a difference of 0.050%), Central American Indian (91.5%, a difference of 0.10%), Dominican (91.1%, a difference of 0.34%), Honduran (91.0%, a difference of 0.37%), and Immigrants from Belize (91.8%, a difference of 0.43%).
| Demographics | Rating | Rank | 9th Grade |
| Ecuadorians | 0.0 /100 | #319 | Tragic 91.9% |
| Nicaraguans | 0.0 /100 | #320 | Tragic 91.9% |
| Immigrants | Ecuador | 0.0 /100 | #321 | Tragic 91.8% |
| Belizeans | 0.0 /100 | #322 | Tragic 91.8% |
| Puerto Ricans | 0.0 /100 | #323 | Tragic 91.8% |
| Immigrants | Belize | 0.0 /100 | #324 | Tragic 91.8% |
| Central American Indians | 0.0 /100 | #325 | Tragic 91.5% |
| Immigrants | Armenia | 0.0 /100 | #326 | Tragic 91.4% |
| Immigrants | Nicaragua | 0.0 /100 | #327 | Tragic 91.3% |
| Dominicans | 0.0 /100 | #328 | Tragic 91.1% |
| Hondurans | 0.0 /100 | #329 | Tragic 91.0% |
| Immigrants | Cabo Verde | 0.0 /100 | #330 | Tragic 90.9% |
| Mexican American Indians | 0.0 /100 | #331 | Tragic 90.9% |
| Hispanics or Latinos | 0.0 /100 | #332 | Tragic 90.9% |
| Immigrants | Yemen | 0.0 /100 | #333 | Tragic 90.8% |