Romanian vs Immigrants from Russia Professional Degree
COMPARE
Romanian
Immigrants from Russia
Professional Degree
Professional Degree Comparison
Romanians
Immigrants from Russia
5.3%
PROFESSIONAL DEGREE
99.6/ 100
METRIC RATING
82nd/ 347
METRIC RANK
6.0%
PROFESSIONAL DEGREE
100.0/ 100
METRIC RATING
36th/ 347
METRIC RANK
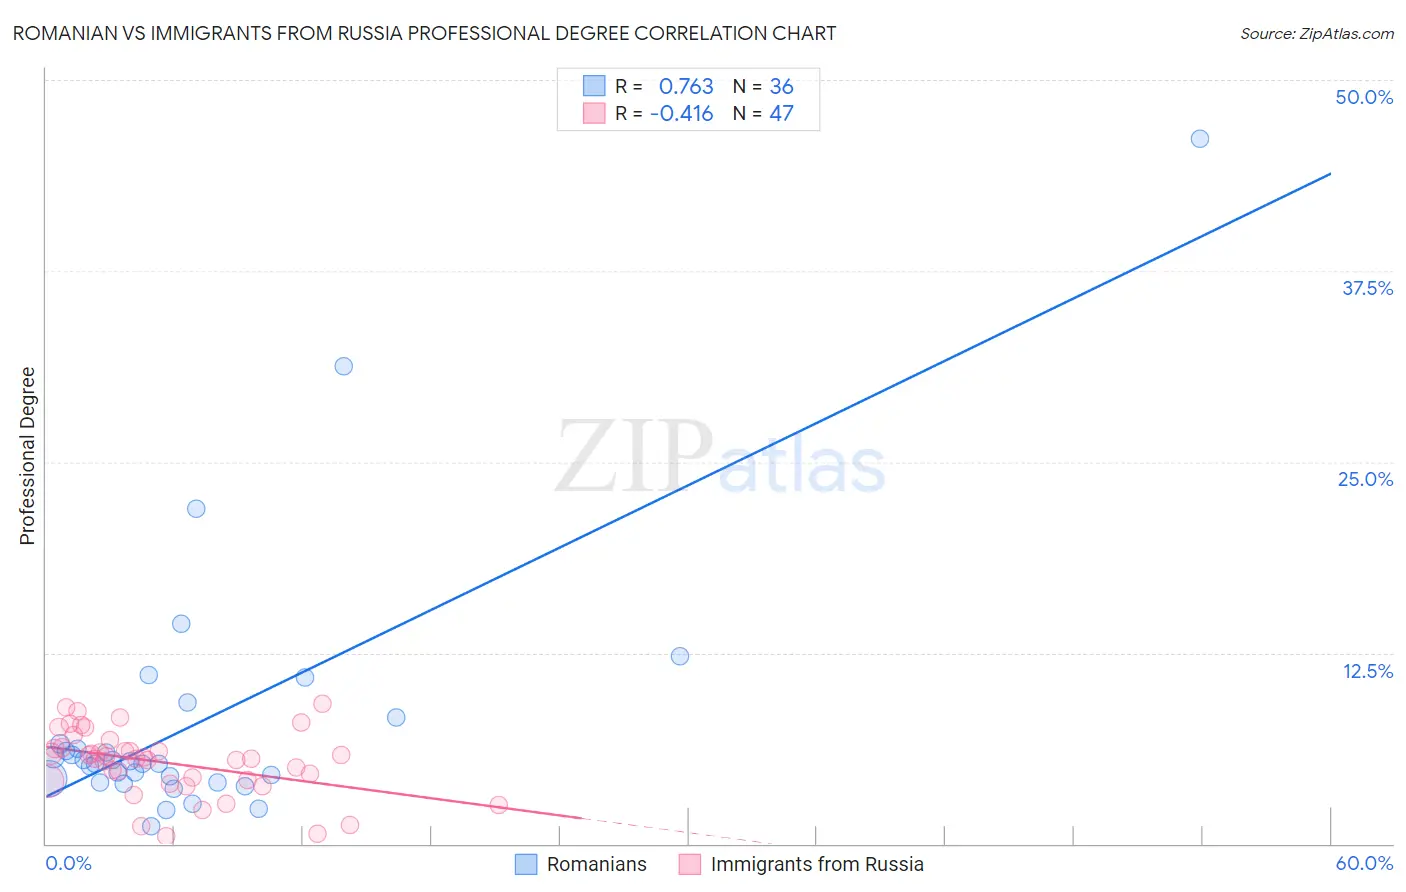
Romanian vs Immigrants from Russia Professional Degree Correlation Chart
The statistical analysis conducted on geographies consisting of 377,177,462 people shows a strong positive correlation between the proportion of Romanians and percentage of population with at least professional degree education in the United States with a correlation coefficient (R) of 0.763 and weighted average of 5.3%. Similarly, the statistical analysis conducted on geographies consisting of 347,458,890 people shows a moderate negative correlation between the proportion of Immigrants from Russia and percentage of population with at least professional degree education in the United States with a correlation coefficient (R) of -0.416 and weighted average of 6.0%, a difference of 14.3%.
Professional Degree Correlation Summary
| Measurement | Romanian | Immigrants from Russia |
| Minimum | 1.1% | 0.49% |
| Maximum | 46.2% | 9.1% |
| Range | 45.0% | 8.6% |
| Mean | 8.0% | 5.3% |
| Median | 5.3% | 5.6% |
| Interquartile 25% (IQ1) | 4.2% | 4.1% |
| Interquartile 75% (IQ3) | 7.4% | 6.3% |
| Interquartile Range (IQR) | 3.2% | 2.2% |
| Standard Deviation (Sample) | 8.7% | 2.1% |
| Standard Deviation (Population) | 8.5% | 2.1% |
Similar Demographics by Professional Degree
Demographics Similar to Romanians by Professional Degree
In terms of professional degree, the demographic groups most similar to Romanians are Carpatho Rusyn (5.3%, a difference of 0.20%), Immigrants from Croatia (5.3%, a difference of 0.20%), Immigrants from Zimbabwe (5.3%, a difference of 0.22%), Greek (5.3%, a difference of 0.23%), and Immigrants from Chile (5.3%, a difference of 0.33%).
| Demographics | Rating | Rank | Professional Degree |
| Immigrants | Indonesia | 99.7 /100 | #75 | Exceptional 5.3% |
| Immigrants | Canada | 99.7 /100 | #76 | Exceptional 5.3% |
| Immigrants | Ethiopia | 99.7 /100 | #77 | Exceptional 5.3% |
| Armenians | 99.7 /100 | #78 | Exceptional 5.3% |
| Immigrants | North America | 99.7 /100 | #79 | Exceptional 5.3% |
| Immigrants | England | 99.6 /100 | #80 | Exceptional 5.3% |
| Immigrants | Brazil | 99.6 /100 | #81 | Exceptional 5.3% |
| Romanians | 99.6 /100 | #82 | Exceptional 5.3% |
| Carpatho Rusyns | 99.6 /100 | #83 | Exceptional 5.3% |
| Immigrants | Croatia | 99.6 /100 | #84 | Exceptional 5.3% |
| Immigrants | Zimbabwe | 99.6 /100 | #85 | Exceptional 5.3% |
| Greeks | 99.6 /100 | #86 | Exceptional 5.3% |
| Immigrants | Chile | 99.5 /100 | #87 | Exceptional 5.3% |
| Egyptians | 99.5 /100 | #88 | Exceptional 5.3% |
| Chileans | 99.5 /100 | #89 | Exceptional 5.3% |
Demographics Similar to Immigrants from Russia by Professional Degree
In terms of professional degree, the demographic groups most similar to Immigrants from Russia are Immigrants from Austria (6.0%, a difference of 0.32%), Immigrants from Norway (6.0%, a difference of 0.51%), Immigrants from South Africa (6.0%, a difference of 0.77%), Immigrants from Korea (6.1%, a difference of 0.90%), and Cambodian (6.0%, a difference of 1.2%).
| Demographics | Rating | Rank | Professional Degree |
| Immigrants | Sri Lanka | 100.0 /100 | #29 | Exceptional 6.2% |
| Immigrants | Turkey | 100.0 /100 | #30 | Exceptional 6.2% |
| Immigrants | India | 100.0 /100 | #31 | Exceptional 6.2% |
| Thais | 100.0 /100 | #32 | Exceptional 6.1% |
| Burmese | 100.0 /100 | #33 | Exceptional 6.1% |
| Mongolians | 100.0 /100 | #34 | Exceptional 6.1% |
| Immigrants | Korea | 100.0 /100 | #35 | Exceptional 6.1% |
| Immigrants | Russia | 100.0 /100 | #36 | Exceptional 6.0% |
| Immigrants | Austria | 100.0 /100 | #37 | Exceptional 6.0% |
| Immigrants | Norway | 100.0 /100 | #38 | Exceptional 6.0% |
| Immigrants | South Africa | 100.0 /100 | #39 | Exceptional 6.0% |
| Cambodians | 100.0 /100 | #40 | Exceptional 6.0% |
| New Zealanders | 100.0 /100 | #41 | Exceptional 6.0% |
| Estonians | 100.0 /100 | #42 | Exceptional 6.0% |
| Immigrants | Saudi Arabia | 100.0 /100 | #43 | Exceptional 5.9% |