Immigrants vs Immigrants from Russia Professional Degree
COMPARE
Immigrants
Immigrants from Russia
Professional Degree
Professional Degree Comparison
Immigrants
Immigrants from Russia
4.4%
PROFESSIONAL DEGREE
43.2/ 100
METRIC RATING
182nd/ 347
METRIC RANK
6.0%
PROFESSIONAL DEGREE
100.0/ 100
METRIC RATING
36th/ 347
METRIC RANK
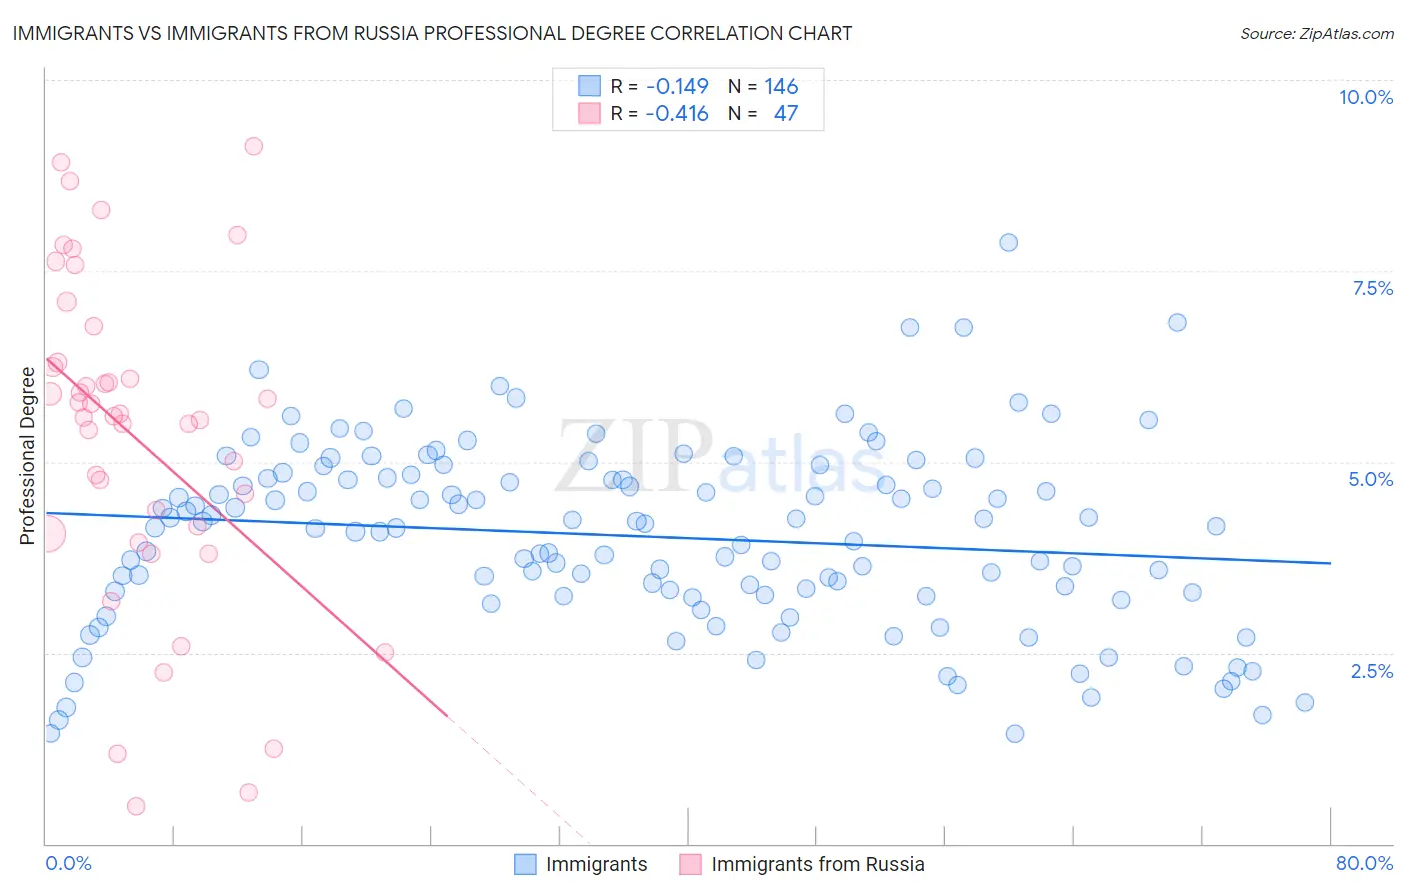
Immigrants vs Immigrants from Russia Professional Degree Correlation Chart
The statistical analysis conducted on geographies consisting of 568,546,540 people shows a poor negative correlation between the proportion of Immigrants and percentage of population with at least professional degree education in the United States with a correlation coefficient (R) of -0.149 and weighted average of 4.4%. Similarly, the statistical analysis conducted on geographies consisting of 347,458,890 people shows a moderate negative correlation between the proportion of Immigrants from Russia and percentage of population with at least professional degree education in the United States with a correlation coefficient (R) of -0.416 and weighted average of 6.0%, a difference of 38.5%.
Professional Degree Correlation Summary
| Measurement | Immigrants | Immigrants from Russia |
| Minimum | 1.4% | 0.49% |
| Maximum | 7.9% | 9.1% |
| Range | 6.4% | 8.6% |
| Mean | 4.0% | 5.3% |
| Median | 4.1% | 5.6% |
| Interquartile 25% (IQ1) | 3.3% | 4.1% |
| Interquartile 75% (IQ3) | 4.8% | 6.3% |
| Interquartile Range (IQR) | 1.5% | 2.2% |
| Standard Deviation (Sample) | 1.2% | 2.1% |
| Standard Deviation (Population) | 1.2% | 2.1% |
Similar Demographics by Professional Degree
Demographics Similar to Immigrants by Professional Degree
In terms of professional degree, the demographic groups most similar to Immigrants are Bermudan (4.4%, a difference of 0.010%), Danish (4.4%, a difference of 0.040%), Czech (4.4%, a difference of 0.26%), Immigrants from Kenya (4.4%, a difference of 0.41%), and Immigrants from Costa Rica (4.4%, a difference of 0.52%).
| Demographics | Rating | Rank | Professional Degree |
| Irish | 50.0 /100 | #175 | Average 4.4% |
| Immigrants | Peru | 49.3 /100 | #176 | Average 4.4% |
| Celtics | 47.6 /100 | #177 | Average 4.4% |
| Immigrants | Costa Rica | 46.7 /100 | #178 | Average 4.4% |
| Immigrants | Kenya | 45.9 /100 | #179 | Average 4.4% |
| Czechs | 44.9 /100 | #180 | Average 4.4% |
| Danes | 43.5 /100 | #181 | Average 4.4% |
| Immigrants | Immigrants | 43.2 /100 | #182 | Average 4.4% |
| Bermudans | 43.1 /100 | #183 | Average 4.4% |
| Belgians | 36.2 /100 | #184 | Fair 4.3% |
| Welsh | 35.8 /100 | #185 | Fair 4.3% |
| Scotch-Irish | 34.2 /100 | #186 | Fair 4.3% |
| Immigrants | Cameroon | 33.3 /100 | #187 | Fair 4.3% |
| Immigrants | Thailand | 31.7 /100 | #188 | Fair 4.3% |
| Slovaks | 30.7 /100 | #189 | Fair 4.3% |
Demographics Similar to Immigrants from Russia by Professional Degree
In terms of professional degree, the demographic groups most similar to Immigrants from Russia are Immigrants from Austria (6.0%, a difference of 0.32%), Immigrants from Norway (6.0%, a difference of 0.51%), Immigrants from South Africa (6.0%, a difference of 0.77%), Immigrants from Korea (6.1%, a difference of 0.90%), and Cambodian (6.0%, a difference of 1.2%).
| Demographics | Rating | Rank | Professional Degree |
| Immigrants | Sri Lanka | 100.0 /100 | #29 | Exceptional 6.2% |
| Immigrants | Turkey | 100.0 /100 | #30 | Exceptional 6.2% |
| Immigrants | India | 100.0 /100 | #31 | Exceptional 6.2% |
| Thais | 100.0 /100 | #32 | Exceptional 6.1% |
| Burmese | 100.0 /100 | #33 | Exceptional 6.1% |
| Mongolians | 100.0 /100 | #34 | Exceptional 6.1% |
| Immigrants | Korea | 100.0 /100 | #35 | Exceptional 6.1% |
| Immigrants | Russia | 100.0 /100 | #36 | Exceptional 6.0% |
| Immigrants | Austria | 100.0 /100 | #37 | Exceptional 6.0% |
| Immigrants | Norway | 100.0 /100 | #38 | Exceptional 6.0% |
| Immigrants | South Africa | 100.0 /100 | #39 | Exceptional 6.0% |
| Cambodians | 100.0 /100 | #40 | Exceptional 6.0% |
| New Zealanders | 100.0 /100 | #41 | Exceptional 6.0% |
| Estonians | 100.0 /100 | #42 | Exceptional 6.0% |
| Immigrants | Saudi Arabia | 100.0 /100 | #43 | Exceptional 5.9% |