Romanian vs Immigrants from Latin America Professional Degree
COMPARE
Romanian
Immigrants from Latin America
Professional Degree
Professional Degree Comparison
Romanians
Immigrants from Latin America
5.3%
PROFESSIONAL DEGREE
99.6/ 100
METRIC RATING
82nd/ 347
METRIC RANK
3.3%
PROFESSIONAL DEGREE
0.1/ 100
METRIC RATING
310th/ 347
METRIC RANK
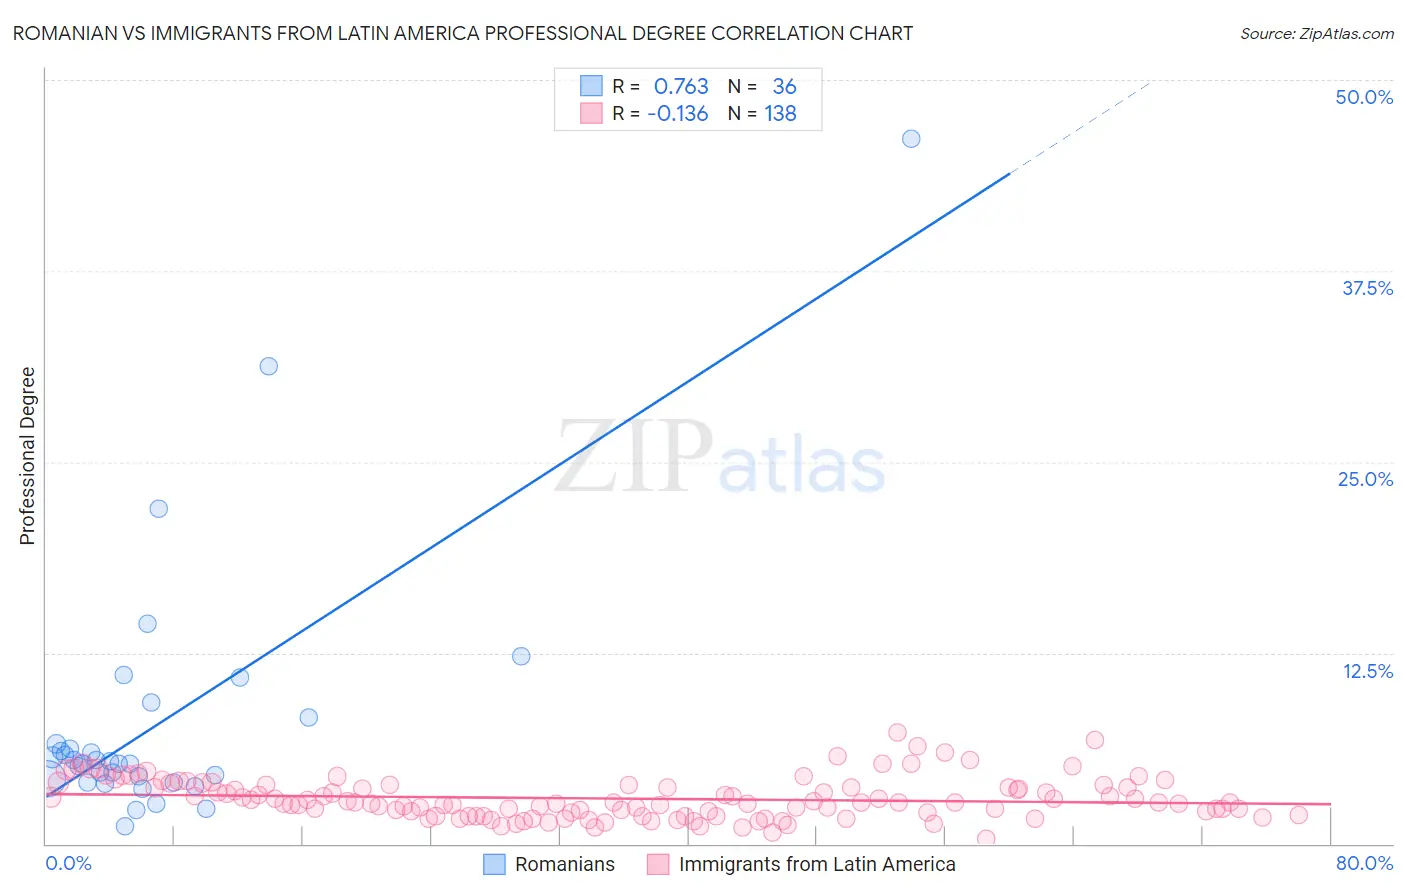
Romanian vs Immigrants from Latin America Professional Degree Correlation Chart
The statistical analysis conducted on geographies consisting of 377,177,462 people shows a strong positive correlation between the proportion of Romanians and percentage of population with at least professional degree education in the United States with a correlation coefficient (R) of 0.763 and weighted average of 5.3%. Similarly, the statistical analysis conducted on geographies consisting of 551,972,291 people shows a poor negative correlation between the proportion of Immigrants from Latin America and percentage of population with at least professional degree education in the United States with a correlation coefficient (R) of -0.136 and weighted average of 3.3%, a difference of 60.2%.
Professional Degree Correlation Summary
| Measurement | Romanian | Immigrants from Latin America |
| Minimum | 1.1% | 0.34% |
| Maximum | 46.2% | 7.3% |
| Range | 45.0% | 6.9% |
| Mean | 8.0% | 3.0% |
| Median | 5.3% | 2.7% |
| Interquartile 25% (IQ1) | 4.2% | 1.8% |
| Interquartile 75% (IQ3) | 7.4% | 3.8% |
| Interquartile Range (IQR) | 3.2% | 2.0% |
| Standard Deviation (Sample) | 8.7% | 1.3% |
| Standard Deviation (Population) | 8.5% | 1.3% |
Similar Demographics by Professional Degree
Demographics Similar to Romanians by Professional Degree
In terms of professional degree, the demographic groups most similar to Romanians are Carpatho Rusyn (5.3%, a difference of 0.20%), Immigrants from Croatia (5.3%, a difference of 0.20%), Immigrants from Zimbabwe (5.3%, a difference of 0.22%), Greek (5.3%, a difference of 0.23%), and Immigrants from Chile (5.3%, a difference of 0.33%).
| Demographics | Rating | Rank | Professional Degree |
| Immigrants | Indonesia | 99.7 /100 | #75 | Exceptional 5.3% |
| Immigrants | Canada | 99.7 /100 | #76 | Exceptional 5.3% |
| Immigrants | Ethiopia | 99.7 /100 | #77 | Exceptional 5.3% |
| Armenians | 99.7 /100 | #78 | Exceptional 5.3% |
| Immigrants | North America | 99.7 /100 | #79 | Exceptional 5.3% |
| Immigrants | England | 99.6 /100 | #80 | Exceptional 5.3% |
| Immigrants | Brazil | 99.6 /100 | #81 | Exceptional 5.3% |
| Romanians | 99.6 /100 | #82 | Exceptional 5.3% |
| Carpatho Rusyns | 99.6 /100 | #83 | Exceptional 5.3% |
| Immigrants | Croatia | 99.6 /100 | #84 | Exceptional 5.3% |
| Immigrants | Zimbabwe | 99.6 /100 | #85 | Exceptional 5.3% |
| Greeks | 99.6 /100 | #86 | Exceptional 5.3% |
| Immigrants | Chile | 99.5 /100 | #87 | Exceptional 5.3% |
| Egyptians | 99.5 /100 | #88 | Exceptional 5.3% |
| Chileans | 99.5 /100 | #89 | Exceptional 5.3% |
Demographics Similar to Immigrants from Latin America by Professional Degree
In terms of professional degree, the demographic groups most similar to Immigrants from Latin America are Cherokee (3.3%, a difference of 0.15%), Pima (3.3%, a difference of 0.32%), Shoshone (3.3%, a difference of 0.33%), Sioux (3.3%, a difference of 0.75%), and Yuman (3.3%, a difference of 0.76%).
| Demographics | Rating | Rank | Professional Degree |
| Immigrants | Haiti | 0.2 /100 | #303 | Tragic 3.4% |
| Cajuns | 0.2 /100 | #304 | Tragic 3.4% |
| Chickasaw | 0.1 /100 | #305 | Tragic 3.4% |
| Cape Verdeans | 0.1 /100 | #306 | Tragic 3.4% |
| Samoans | 0.1 /100 | #307 | Tragic 3.3% |
| Shoshone | 0.1 /100 | #308 | Tragic 3.3% |
| Pima | 0.1 /100 | #309 | Tragic 3.3% |
| Immigrants | Latin America | 0.1 /100 | #310 | Tragic 3.3% |
| Cherokee | 0.1 /100 | #311 | Tragic 3.3% |
| Sioux | 0.1 /100 | #312 | Tragic 3.3% |
| Yuman | 0.1 /100 | #313 | Tragic 3.3% |
| Mexican American Indians | 0.1 /100 | #314 | Tragic 3.3% |
| Immigrants | Laos | 0.1 /100 | #315 | Tragic 3.2% |
| Puerto Ricans | 0.1 /100 | #316 | Tragic 3.2% |
| Nepalese | 0.1 /100 | #317 | Tragic 3.2% |