Romanian vs Belgian Professional Degree
COMPARE
Romanian
Belgian
Professional Degree
Professional Degree Comparison
Romanians
Belgians
5.3%
PROFESSIONAL DEGREE
99.6/ 100
METRIC RATING
82nd/ 347
METRIC RANK
4.3%
PROFESSIONAL DEGREE
36.2/ 100
METRIC RATING
184th/ 347
METRIC RANK
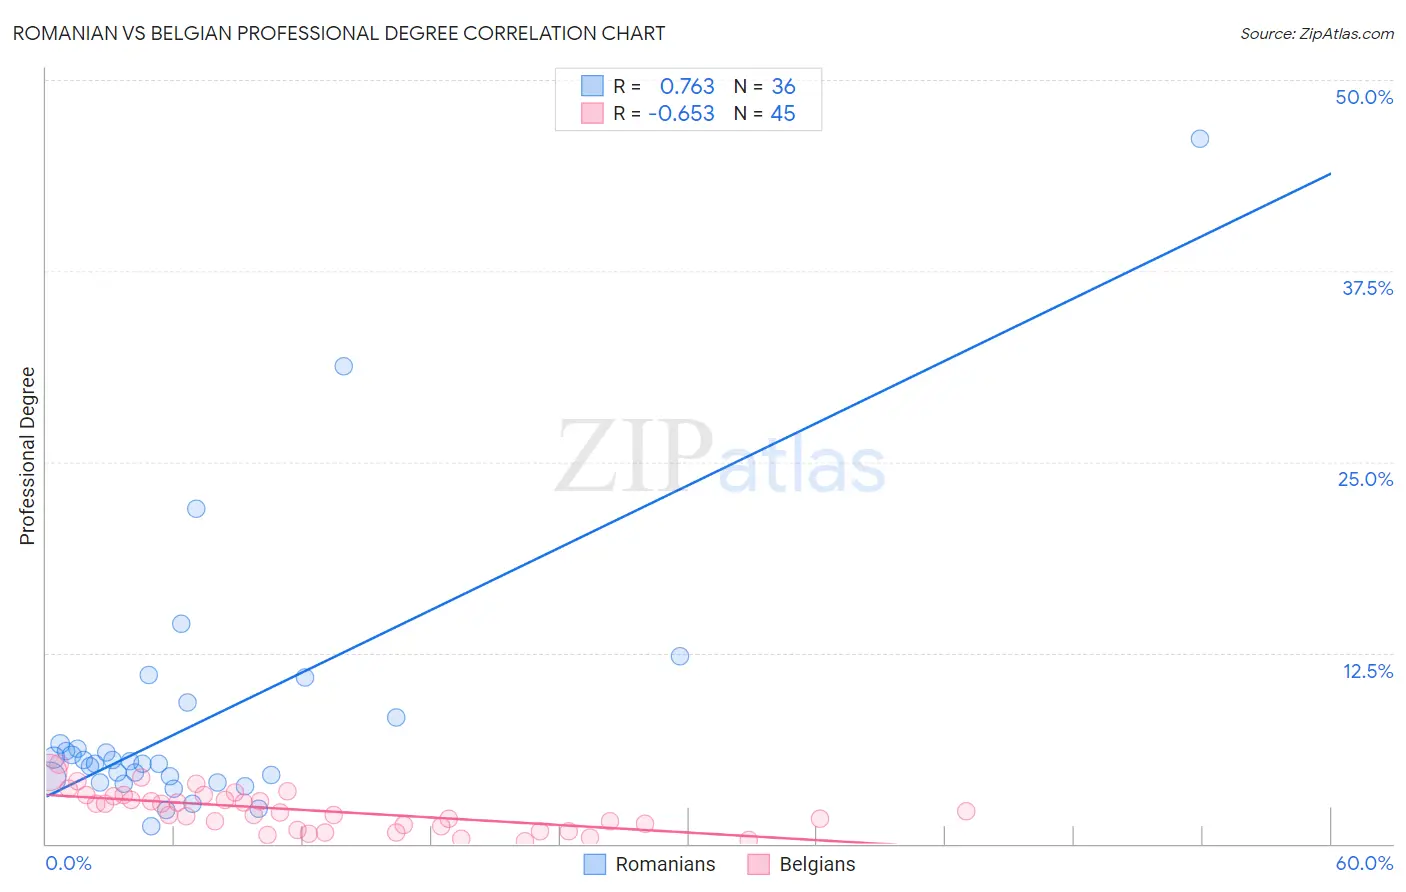
Romanian vs Belgian Professional Degree Correlation Chart
The statistical analysis conducted on geographies consisting of 377,177,462 people shows a strong positive correlation between the proportion of Romanians and percentage of population with at least professional degree education in the United States with a correlation coefficient (R) of 0.763 and weighted average of 5.3%. Similarly, the statistical analysis conducted on geographies consisting of 355,034,789 people shows a significant negative correlation between the proportion of Belgians and percentage of population with at least professional degree education in the United States with a correlation coefficient (R) of -0.653 and weighted average of 4.3%, a difference of 22.4%.
Professional Degree Correlation Summary
| Measurement | Romanian | Belgian |
| Minimum | 1.1% | 0.19% |
| Maximum | 46.2% | 5.2% |
| Range | 45.0% | 5.0% |
| Mean | 8.0% | 2.2% |
| Median | 5.3% | 2.0% |
| Interquartile 25% (IQ1) | 4.2% | 1.0% |
| Interquartile 75% (IQ3) | 7.4% | 3.2% |
| Interquartile Range (IQR) | 3.2% | 2.1% |
| Standard Deviation (Sample) | 8.7% | 1.3% |
| Standard Deviation (Population) | 8.5% | 1.3% |
Similar Demographics by Professional Degree
Demographics Similar to Romanians by Professional Degree
In terms of professional degree, the demographic groups most similar to Romanians are Carpatho Rusyn (5.3%, a difference of 0.20%), Immigrants from Croatia (5.3%, a difference of 0.20%), Immigrants from Zimbabwe (5.3%, a difference of 0.22%), Greek (5.3%, a difference of 0.23%), and Immigrants from Chile (5.3%, a difference of 0.33%).
| Demographics | Rating | Rank | Professional Degree |
| Immigrants | Indonesia | 99.7 /100 | #75 | Exceptional 5.3% |
| Immigrants | Canada | 99.7 /100 | #76 | Exceptional 5.3% |
| Immigrants | Ethiopia | 99.7 /100 | #77 | Exceptional 5.3% |
| Armenians | 99.7 /100 | #78 | Exceptional 5.3% |
| Immigrants | North America | 99.7 /100 | #79 | Exceptional 5.3% |
| Immigrants | England | 99.6 /100 | #80 | Exceptional 5.3% |
| Immigrants | Brazil | 99.6 /100 | #81 | Exceptional 5.3% |
| Romanians | 99.6 /100 | #82 | Exceptional 5.3% |
| Carpatho Rusyns | 99.6 /100 | #83 | Exceptional 5.3% |
| Immigrants | Croatia | 99.6 /100 | #84 | Exceptional 5.3% |
| Immigrants | Zimbabwe | 99.6 /100 | #85 | Exceptional 5.3% |
| Greeks | 99.6 /100 | #86 | Exceptional 5.3% |
| Immigrants | Chile | 99.5 /100 | #87 | Exceptional 5.3% |
| Egyptians | 99.5 /100 | #88 | Exceptional 5.3% |
| Chileans | 99.5 /100 | #89 | Exceptional 5.3% |
Demographics Similar to Belgians by Professional Degree
In terms of professional degree, the demographic groups most similar to Belgians are Welsh (4.3%, a difference of 0.060%), Scotch-Irish (4.3%, a difference of 0.32%), Immigrants from Cameroon (4.3%, a difference of 0.47%), Immigrants from Thailand (4.3%, a difference of 0.75%), and Slovak (4.3%, a difference of 0.92%).
| Demographics | Rating | Rank | Professional Degree |
| Celtics | 47.6 /100 | #177 | Average 4.4% |
| Immigrants | Costa Rica | 46.7 /100 | #178 | Average 4.4% |
| Immigrants | Kenya | 45.9 /100 | #179 | Average 4.4% |
| Czechs | 44.9 /100 | #180 | Average 4.4% |
| Danes | 43.5 /100 | #181 | Average 4.4% |
| Immigrants | Immigrants | 43.2 /100 | #182 | Average 4.4% |
| Bermudans | 43.1 /100 | #183 | Average 4.4% |
| Belgians | 36.2 /100 | #184 | Fair 4.3% |
| Welsh | 35.8 /100 | #185 | Fair 4.3% |
| Scotch-Irish | 34.2 /100 | #186 | Fair 4.3% |
| Immigrants | Cameroon | 33.3 /100 | #187 | Fair 4.3% |
| Immigrants | Thailand | 31.7 /100 | #188 | Fair 4.3% |
| Slovaks | 30.7 /100 | #189 | Fair 4.3% |
| Immigrants | Poland | 29.2 /100 | #190 | Fair 4.3% |
| Sri Lankans | 29.0 /100 | #191 | Fair 4.3% |