Lumbee vs Immigrants from Russia Professional Degree
COMPARE
Lumbee
Immigrants from Russia
Professional Degree
Professional Degree Comparison
Lumbee
Immigrants from Russia
2.5%
PROFESSIONAL DEGREE
0.0/ 100
METRIC RATING
346th/ 347
METRIC RANK
6.0%
PROFESSIONAL DEGREE
100.0/ 100
METRIC RATING
36th/ 347
METRIC RANK
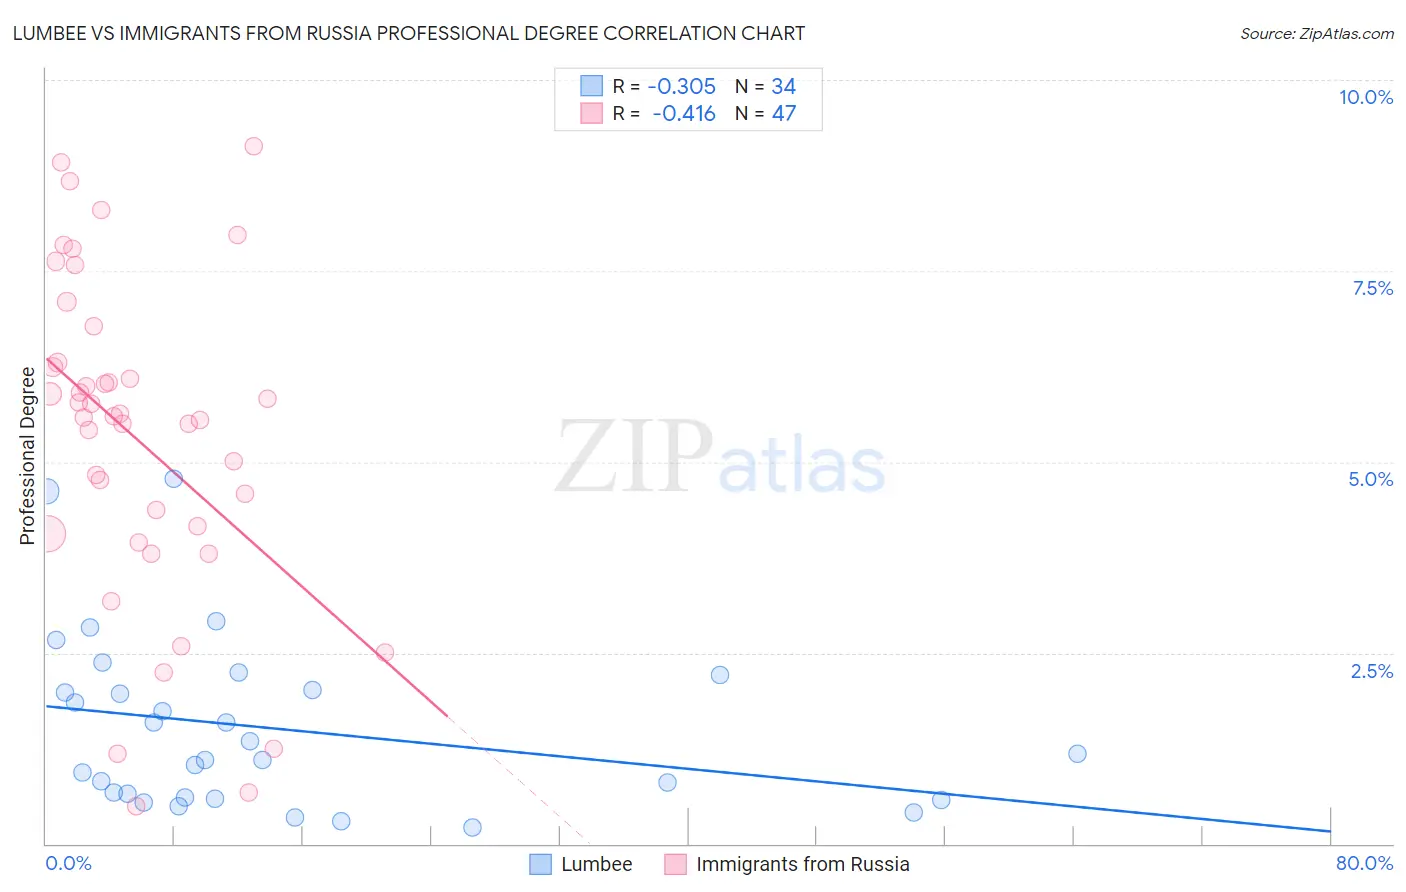
Lumbee vs Immigrants from Russia Professional Degree Correlation Chart
The statistical analysis conducted on geographies consisting of 92,157,121 people shows a mild negative correlation between the proportion of Lumbee and percentage of population with at least professional degree education in the United States with a correlation coefficient (R) of -0.305 and weighted average of 2.5%. Similarly, the statistical analysis conducted on geographies consisting of 347,458,890 people shows a moderate negative correlation between the proportion of Immigrants from Russia and percentage of population with at least professional degree education in the United States with a correlation coefficient (R) of -0.416 and weighted average of 6.0%, a difference of 145.3%.
Professional Degree Correlation Summary
| Measurement | Lumbee | Immigrants from Russia |
| Minimum | 0.22% | 0.49% |
| Maximum | 4.8% | 9.1% |
| Range | 4.6% | 8.6% |
| Mean | 1.5% | 5.3% |
| Median | 1.1% | 5.6% |
| Interquartile 25% (IQ1) | 0.60% | 4.1% |
| Interquartile 75% (IQ3) | 2.0% | 6.3% |
| Interquartile Range (IQR) | 1.4% | 2.2% |
| Standard Deviation (Sample) | 1.1% | 2.1% |
| Standard Deviation (Population) | 1.1% | 2.1% |
Similar Demographics by Professional Degree
Demographics Similar to Lumbee by Professional Degree
In terms of professional degree, the demographic groups most similar to Lumbee are Immigrants from Mexico (2.6%, a difference of 7.4%), Spanish American Indian (2.7%, a difference of 7.7%), Houma (2.2%, a difference of 11.1%), Mexican (2.7%, a difference of 11.7%), and Immigrants from the Azores (2.8%, a difference of 14.8%).
| Demographics | Rating | Rank | Professional Degree |
| Puget Sound Salish | 0.0 /100 | #333 | Tragic 3.1% |
| Pennsylvania Germans | 0.0 /100 | #334 | Tragic 3.0% |
| Natives/Alaskans | 0.0 /100 | #335 | Tragic 3.0% |
| Fijians | 0.0 /100 | #336 | Tragic 2.9% |
| Arapaho | 0.0 /100 | #337 | Tragic 2.9% |
| Navajo | 0.0 /100 | #338 | Tragic 2.9% |
| Immigrants | Central America | 0.0 /100 | #339 | Tragic 2.9% |
| Yup'ik | 0.0 /100 | #340 | Tragic 2.9% |
| Tohono O'odham | 0.0 /100 | #341 | Tragic 2.8% |
| Immigrants | Azores | 0.0 /100 | #342 | Tragic 2.8% |
| Mexicans | 0.0 /100 | #343 | Tragic 2.7% |
| Spanish American Indians | 0.0 /100 | #344 | Tragic 2.7% |
| Immigrants | Mexico | 0.0 /100 | #345 | Tragic 2.6% |
| Lumbee | 0.0 /100 | #346 | Tragic 2.5% |
| Houma | 0.0 /100 | #347 | Tragic 2.2% |
Demographics Similar to Immigrants from Russia by Professional Degree
In terms of professional degree, the demographic groups most similar to Immigrants from Russia are Immigrants from Austria (6.0%, a difference of 0.32%), Immigrants from Norway (6.0%, a difference of 0.51%), Immigrants from South Africa (6.0%, a difference of 0.77%), Immigrants from Korea (6.1%, a difference of 0.90%), and Cambodian (6.0%, a difference of 1.2%).
| Demographics | Rating | Rank | Professional Degree |
| Immigrants | Sri Lanka | 100.0 /100 | #29 | Exceptional 6.2% |
| Immigrants | Turkey | 100.0 /100 | #30 | Exceptional 6.2% |
| Immigrants | India | 100.0 /100 | #31 | Exceptional 6.2% |
| Thais | 100.0 /100 | #32 | Exceptional 6.1% |
| Burmese | 100.0 /100 | #33 | Exceptional 6.1% |
| Mongolians | 100.0 /100 | #34 | Exceptional 6.1% |
| Immigrants | Korea | 100.0 /100 | #35 | Exceptional 6.1% |
| Immigrants | Russia | 100.0 /100 | #36 | Exceptional 6.0% |
| Immigrants | Austria | 100.0 /100 | #37 | Exceptional 6.0% |
| Immigrants | Norway | 100.0 /100 | #38 | Exceptional 6.0% |
| Immigrants | South Africa | 100.0 /100 | #39 | Exceptional 6.0% |
| Cambodians | 100.0 /100 | #40 | Exceptional 6.0% |
| New Zealanders | 100.0 /100 | #41 | Exceptional 6.0% |
| Estonians | 100.0 /100 | #42 | Exceptional 6.0% |
| Immigrants | Saudi Arabia | 100.0 /100 | #43 | Exceptional 5.9% |