Paraguayan vs Immigrants from Poland 7th Grade
COMPARE
Paraguayan
Immigrants from Poland
7th Grade
7th Grade Comparison
Paraguayans
Immigrants from Poland
95.9%
7TH GRADE
24.8/ 100
METRIC RATING
198th/ 347
METRIC RANK
96.1%
7TH GRADE
59.0/ 100
METRIC RATING
168th/ 347
METRIC RANK
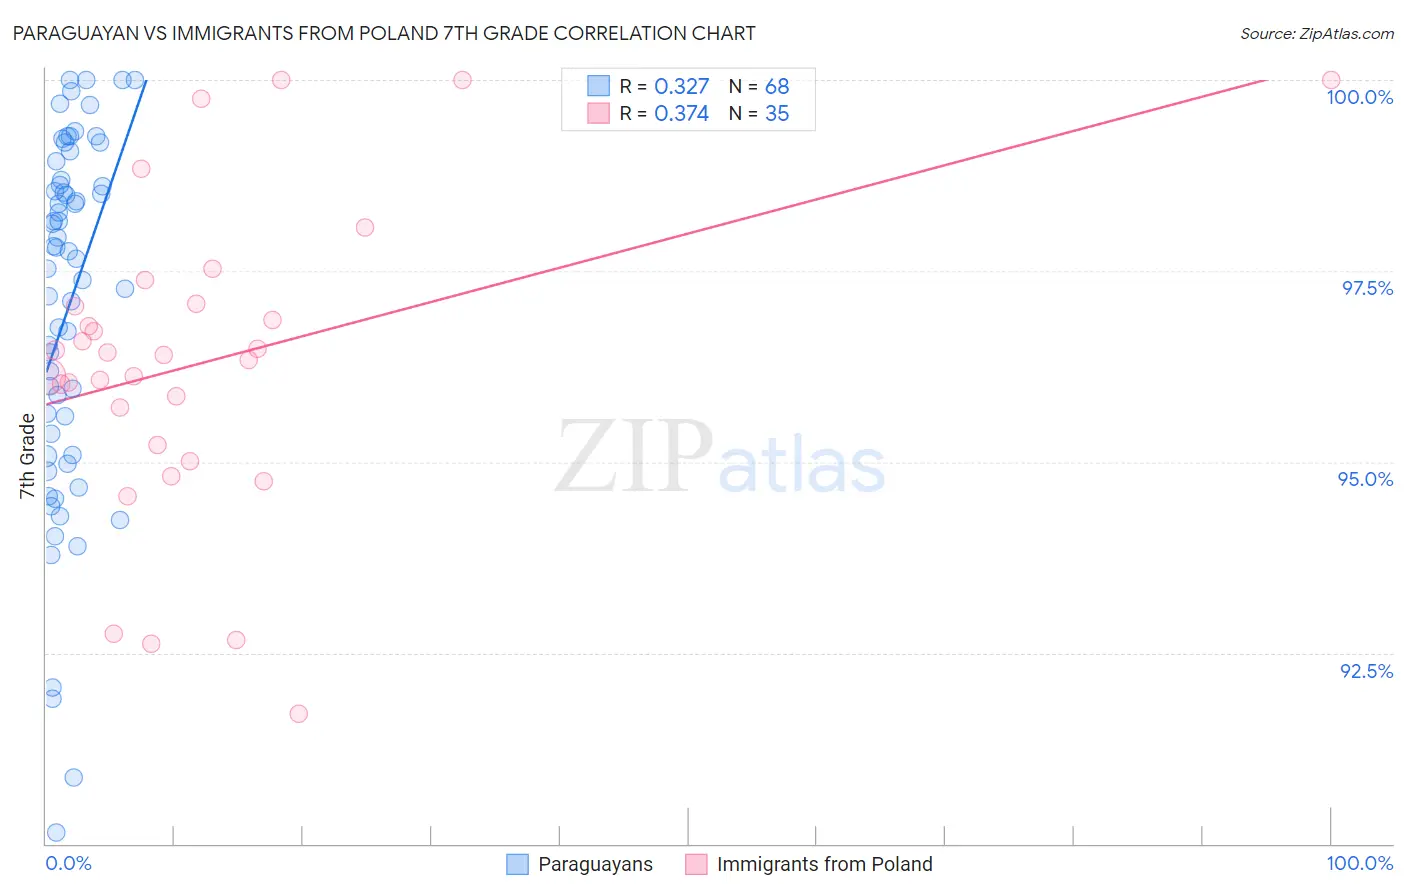
Paraguayan vs Immigrants from Poland 7th Grade Correlation Chart
The statistical analysis conducted on geographies consisting of 95,115,093 people shows a mild positive correlation between the proportion of Paraguayans and percentage of population with at least 7th grade education in the United States with a correlation coefficient (R) of 0.327 and weighted average of 95.9%. Similarly, the statistical analysis conducted on geographies consisting of 304,861,877 people shows a mild positive correlation between the proportion of Immigrants from Poland and percentage of population with at least 7th grade education in the United States with a correlation coefficient (R) of 0.374 and weighted average of 96.1%, a difference of 0.23%.
7th Grade Correlation Summary
| Measurement | Paraguayan | Immigrants from Poland |
| Minimum | 90.2% | 91.7% |
| Maximum | 100.0% | 100.0% |
| Range | 9.8% | 8.3% |
| Mean | 97.0% | 96.3% |
| Median | 97.7% | 96.4% |
| Interquartile 25% (IQ1) | 95.2% | 95.2% |
| Interquartile 75% (IQ3) | 98.7% | 97.1% |
| Interquartile Range (IQR) | 3.4% | 1.8% |
| Standard Deviation (Sample) | 2.3% | 2.0% |
| Standard Deviation (Population) | 2.3% | 2.0% |
Similar Demographics by 7th Grade
Demographics Similar to Paraguayans by 7th Grade
In terms of 7th grade, the demographic groups most similar to Paraguayans are Guamanian/Chamorro (95.9%, a difference of 0.010%), Argentinean (95.9%, a difference of 0.010%), Apache (95.9%, a difference of 0.020%), Immigrants from Zaire (95.9%, a difference of 0.020%), and Immigrants from Argentina (95.9%, a difference of 0.020%).
| Demographics | Rating | Rank | 7th Grade |
| Liberians | 32.5 /100 | #191 | Fair 95.9% |
| Panamanians | 32.3 /100 | #192 | Fair 95.9% |
| Immigrants | Bahamas | 30.8 /100 | #193 | Fair 95.9% |
| Immigrants | Nepal | 30.0 /100 | #194 | Fair 95.9% |
| Sudanese | 28.1 /100 | #195 | Fair 95.9% |
| Apache | 27.6 /100 | #196 | Fair 95.9% |
| Immigrants | Zaire | 26.7 /100 | #197 | Fair 95.9% |
| Paraguayans | 24.8 /100 | #198 | Fair 95.9% |
| Guamanians/Chamorros | 23.5 /100 | #199 | Fair 95.9% |
| Argentineans | 23.2 /100 | #200 | Fair 95.9% |
| Immigrants | Argentina | 21.9 /100 | #201 | Fair 95.9% |
| Immigrants | Northern Africa | 21.4 /100 | #202 | Fair 95.8% |
| Comanche | 21.1 /100 | #203 | Fair 95.8% |
| Assyrians/Chaldeans/Syriacs | 20.5 /100 | #204 | Fair 95.8% |
| Moroccans | 18.9 /100 | #205 | Poor 95.8% |
Demographics Similar to Immigrants from Poland by 7th Grade
In terms of 7th grade, the demographic groups most similar to Immigrants from Poland are Immigrants from Kazakhstan (96.1%, a difference of 0.010%), Immigrants from Sri Lanka (96.1%, a difference of 0.010%), Spaniard (96.1%, a difference of 0.020%), Immigrants from Italy (96.1%, a difference of 0.020%), and Immigrants from Taiwan (96.1%, a difference of 0.020%).
| Demographics | Rating | Rank | 7th Grade |
| Bermudans | 66.3 /100 | #161 | Good 96.1% |
| Pima | 64.3 /100 | #162 | Good 96.1% |
| Spaniards | 62.6 /100 | #163 | Good 96.1% |
| Immigrants | Italy | 62.1 /100 | #164 | Good 96.1% |
| Immigrants | Taiwan | 61.5 /100 | #165 | Good 96.1% |
| Immigrants | Kazakhstan | 61.0 /100 | #166 | Good 96.1% |
| Immigrants | Sri Lanka | 59.9 /100 | #167 | Average 96.1% |
| Immigrants | Poland | 59.0 /100 | #168 | Average 96.1% |
| Ute | 55.8 /100 | #169 | Average 96.1% |
| Immigrants | Ukraine | 55.0 /100 | #170 | Average 96.1% |
| Egyptians | 54.2 /100 | #171 | Average 96.1% |
| Venezuelans | 51.4 /100 | #172 | Average 96.0% |
| Immigrants | Albania | 50.4 /100 | #173 | Average 96.0% |
| Mongolians | 50.0 /100 | #174 | Average 96.0% |
| Blacks/African Americans | 49.5 /100 | #175 | Average 96.0% |