Romanian vs Immigrants from Poland 9th Grade
COMPARE
Romanian
Immigrants from Poland
9th Grade
9th Grade Comparison
Romanians
Immigrants from Poland
95.7%
9TH GRADE
99.3/ 100
METRIC RATING
79th/ 347
METRIC RANK
94.9%
9TH GRADE
46.7/ 100
METRIC RATING
178th/ 347
METRIC RANK
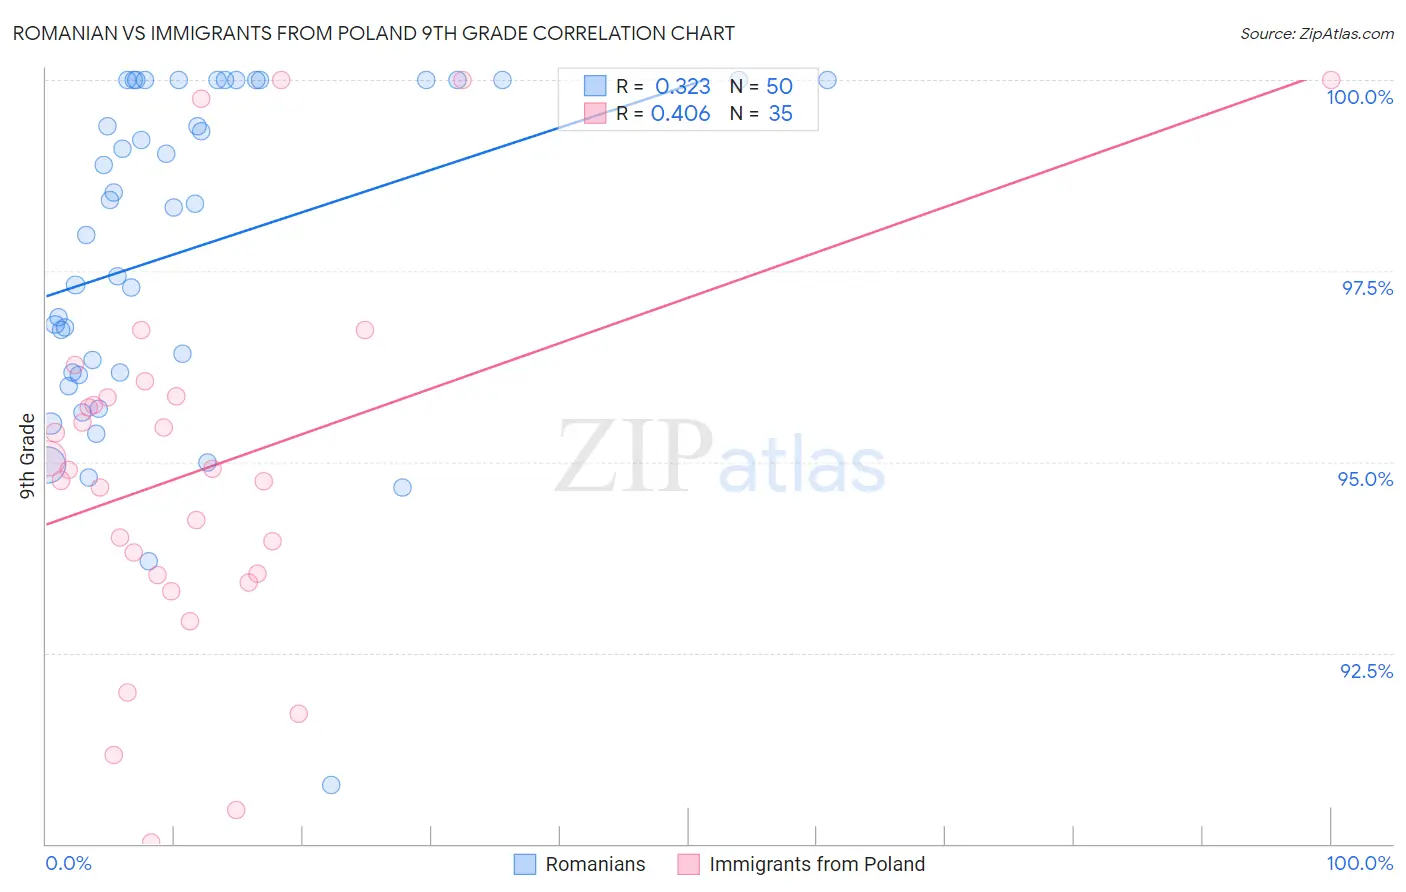
Romanian vs Immigrants from Poland 9th Grade Correlation Chart
The statistical analysis conducted on geographies consisting of 377,904,438 people shows a mild positive correlation between the proportion of Romanians and percentage of population with at least 9th grade education in the United States with a correlation coefficient (R) of 0.323 and weighted average of 95.7%. Similarly, the statistical analysis conducted on geographies consisting of 304,861,877 people shows a moderate positive correlation between the proportion of Immigrants from Poland and percentage of population with at least 9th grade education in the United States with a correlation coefficient (R) of 0.406 and weighted average of 94.9%, a difference of 0.94%.
9th Grade Correlation Summary
| Measurement | Romanian | Immigrants from Poland |
| Minimum | 90.8% | 90.0% |
| Maximum | 100.0% | 100.0% |
| Range | 9.2% | 10.0% |
| Mean | 97.8% | 94.9% |
| Median | 98.4% | 94.9% |
| Interquartile 25% (IQ1) | 96.2% | 93.5% |
| Interquartile 75% (IQ3) | 100.0% | 95.9% |
| Interquartile Range (IQR) | 3.8% | 2.3% |
| Standard Deviation (Sample) | 2.2% | 2.5% |
| Standard Deviation (Population) | 2.1% | 2.4% |
Similar Demographics by 9th Grade
Demographics Similar to Romanians by 9th Grade
In terms of 9th grade, the demographic groups most similar to Romanians are Bhutanese (95.7%, a difference of 0.020%), Arapaho (95.7%, a difference of 0.020%), Puget Sound Salish (95.7%, a difference of 0.020%), White/Caucasian (95.8%, a difference of 0.030%), and Immigrants from South Africa (95.8%, a difference of 0.030%).
| Demographics | Rating | Rank | 9th Grade |
| Turks | 99.5 /100 | #72 | Exceptional 95.8% |
| Immigrants | Singapore | 99.5 /100 | #73 | Exceptional 95.8% |
| Thais | 99.5 /100 | #74 | Exceptional 95.8% |
| Inupiat | 99.5 /100 | #75 | Exceptional 95.8% |
| Immigrants | Sweden | 99.5 /100 | #76 | Exceptional 95.8% |
| Whites/Caucasians | 99.4 /100 | #77 | Exceptional 95.8% |
| Immigrants | South Africa | 99.4 /100 | #78 | Exceptional 95.8% |
| Romanians | 99.3 /100 | #79 | Exceptional 95.7% |
| Bhutanese | 99.3 /100 | #80 | Exceptional 95.7% |
| Arapaho | 99.3 /100 | #81 | Exceptional 95.7% |
| Puget Sound Salish | 99.2 /100 | #82 | Exceptional 95.7% |
| Swiss | 99.2 /100 | #83 | Exceptional 95.7% |
| Immigrants | Denmark | 99.1 /100 | #84 | Exceptional 95.7% |
| Icelanders | 99.1 /100 | #85 | Exceptional 95.7% |
| Immigrants | Western Europe | 99.1 /100 | #86 | Exceptional 95.7% |
Demographics Similar to Immigrants from Poland by 9th Grade
In terms of 9th grade, the demographic groups most similar to Immigrants from Poland are Immigrants from Venezuela (94.9%, a difference of 0.0%), Immigrants from Iraq (94.9%, a difference of 0.010%), Immigrants from Egypt (94.9%, a difference of 0.020%), Brazilian (94.9%, a difference of 0.020%), and Immigrants from Spain (94.9%, a difference of 0.020%).
| Demographics | Rating | Rank | 9th Grade |
| Colville | 58.5 /100 | #171 | Average 94.9% |
| Iraqis | 54.0 /100 | #172 | Average 94.9% |
| Cheyenne | 51.5 /100 | #173 | Average 94.9% |
| Immigrants | Egypt | 50.0 /100 | #174 | Average 94.9% |
| Brazilians | 49.8 /100 | #175 | Average 94.9% |
| Immigrants | Spain | 49.1 /100 | #176 | Average 94.9% |
| Immigrants | Iraq | 47.8 /100 | #177 | Average 94.9% |
| Immigrants | Poland | 46.7 /100 | #178 | Average 94.9% |
| Immigrants | Venezuela | 46.5 /100 | #179 | Average 94.9% |
| Immigrants | Uganda | 43.1 /100 | #180 | Average 94.8% |
| Sierra Leoneans | 42.7 /100 | #181 | Average 94.8% |
| Seminole | 42.5 /100 | #182 | Average 94.8% |
| Immigrants | Nepal | 39.7 /100 | #183 | Fair 94.8% |
| Argentineans | 37.6 /100 | #184 | Fair 94.8% |
| Liberians | 37.4 /100 | #185 | Fair 94.8% |