Thai vs Immigrants from Peru 7th Grade
COMPARE
Thai
Immigrants from Peru
7th Grade
7th Grade Comparison
Thais
Immigrants from Peru
96.7%
7TH GRADE
98.6/ 100
METRIC RATING
101st/ 347
METRIC RANK
94.9%
7TH GRADE
0.0/ 100
METRIC RATING
287th/ 347
METRIC RANK
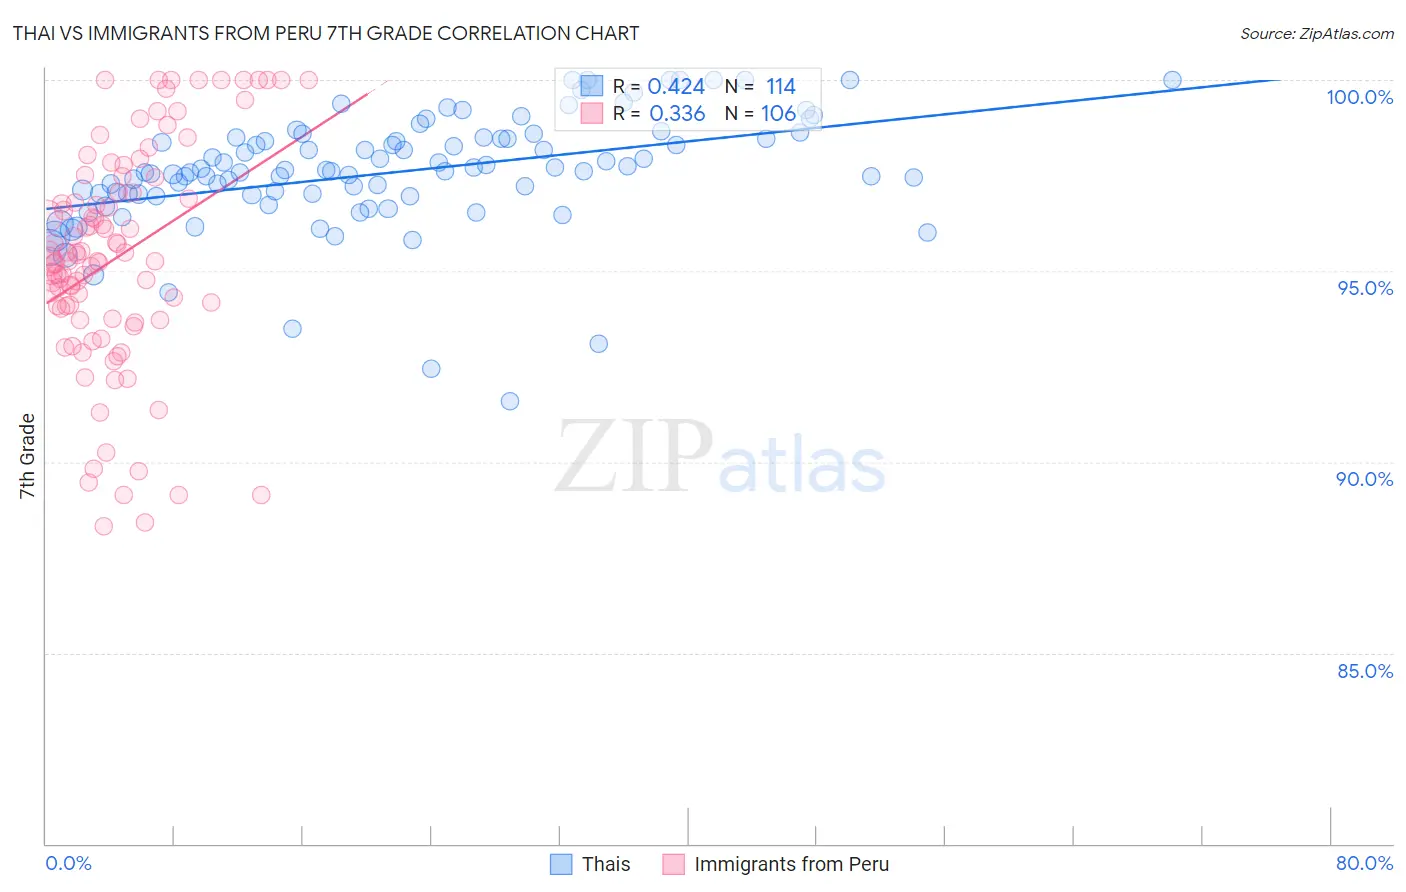
Thai vs Immigrants from Peru 7th Grade Correlation Chart
The statistical analysis conducted on geographies consisting of 475,814,962 people shows a moderate positive correlation between the proportion of Thais and percentage of population with at least 7th grade education in the United States with a correlation coefficient (R) of 0.424 and weighted average of 96.7%. Similarly, the statistical analysis conducted on geographies consisting of 328,685,851 people shows a mild positive correlation between the proportion of Immigrants from Peru and percentage of population with at least 7th grade education in the United States with a correlation coefficient (R) of 0.336 and weighted average of 94.9%, a difference of 1.9%.
7th Grade Correlation Summary
| Measurement | Thai | Immigrants from Peru |
| Minimum | 91.6% | 88.3% |
| Maximum | 100.0% | 100.0% |
| Range | 8.4% | 11.7% |
| Mean | 97.6% | 95.4% |
| Median | 97.6% | 95.3% |
| Interquartile 25% (IQ1) | 97.0% | 93.7% |
| Interquartile 75% (IQ3) | 98.5% | 97.1% |
| Interquartile Range (IQR) | 1.5% | 3.3% |
| Standard Deviation (Sample) | 1.5% | 2.9% |
| Standard Deviation (Population) | 1.5% | 2.9% |
Similar Demographics by 7th Grade
Demographics Similar to Thais by 7th Grade
In terms of 7th grade, the demographic groups most similar to Thais are German Russian (96.7%, a difference of 0.0%), Immigrants from Denmark (96.7%, a difference of 0.010%), Immigrants from Germany (96.7%, a difference of 0.010%), Immigrants from Sweden (96.7%, a difference of 0.010%), and Menominee (96.7%, a difference of 0.010%).
| Demographics | Rating | Rank | 7th Grade |
| Lebanese | 98.8 /100 | #94 | Exceptional 96.7% |
| Immigrants | Australia | 98.8 /100 | #95 | Exceptional 96.7% |
| Immigrants | Denmark | 98.7 /100 | #96 | Exceptional 96.7% |
| Immigrants | Germany | 98.7 /100 | #97 | Exceptional 96.7% |
| Immigrants | Sweden | 98.7 /100 | #98 | Exceptional 96.7% |
| Menominee | 98.7 /100 | #99 | Exceptional 96.7% |
| German Russians | 98.6 /100 | #100 | Exceptional 96.7% |
| Thais | 98.6 /100 | #101 | Exceptional 96.7% |
| Immigrants | Czechoslovakia | 98.3 /100 | #102 | Exceptional 96.6% |
| Immigrants | Singapore | 98.3 /100 | #103 | Exceptional 96.6% |
| Shoshone | 98.1 /100 | #104 | Exceptional 96.6% |
| South Africans | 98.0 /100 | #105 | Exceptional 96.6% |
| Iroquois | 97.9 /100 | #106 | Exceptional 96.6% |
| Lumbee | 97.8 /100 | #107 | Exceptional 96.6% |
| Immigrants | Saudi Arabia | 97.8 /100 | #108 | Exceptional 96.6% |
Demographics Similar to Immigrants from Peru by 7th Grade
In terms of 7th grade, the demographic groups most similar to Immigrants from Peru are Immigrants from Philippines (94.9%, a difference of 0.010%), British West Indian (94.8%, a difference of 0.020%), Taiwanese (94.8%, a difference of 0.030%), Malaysian (94.8%, a difference of 0.050%), and Armenian (95.0%, a difference of 0.090%).
| Demographics | Rating | Rank | 7th Grade |
| Immigrants | St. Vincent and the Grenadines | 0.1 /100 | #280 | Tragic 95.0% |
| Tohono O'odham | 0.1 /100 | #281 | Tragic 95.0% |
| Immigrants | Bolivia | 0.1 /100 | #282 | Tragic 95.0% |
| Immigrants | Barbados | 0.1 /100 | #283 | Tragic 95.0% |
| Armenians | 0.1 /100 | #284 | Tragic 95.0% |
| Immigrants | Eritrea | 0.1 /100 | #285 | Tragic 94.9% |
| Immigrants | Philippines | 0.0 /100 | #286 | Tragic 94.9% |
| Immigrants | Peru | 0.0 /100 | #287 | Tragic 94.9% |
| British West Indians | 0.0 /100 | #288 | Tragic 94.8% |
| Taiwanese | 0.0 /100 | #289 | Tragic 94.8% |
| Malaysians | 0.0 /100 | #290 | Tragic 94.8% |
| Immigrants | Grenada | 0.0 /100 | #291 | Tragic 94.8% |
| Immigrants | West Indies | 0.0 /100 | #292 | Tragic 94.8% |
| Fijians | 0.0 /100 | #293 | Tragic 94.7% |
| Haitians | 0.0 /100 | #294 | Tragic 94.7% |