Nicaraguan vs Immigrants from Peru 7th Grade
COMPARE
Nicaraguan
Immigrants from Peru
7th Grade
7th Grade Comparison
Nicaraguans
Immigrants from Peru
93.5%
7TH GRADE
0.0/ 100
METRIC RATING
322nd/ 347
METRIC RANK
94.9%
7TH GRADE
0.0/ 100
METRIC RATING
287th/ 347
METRIC RANK
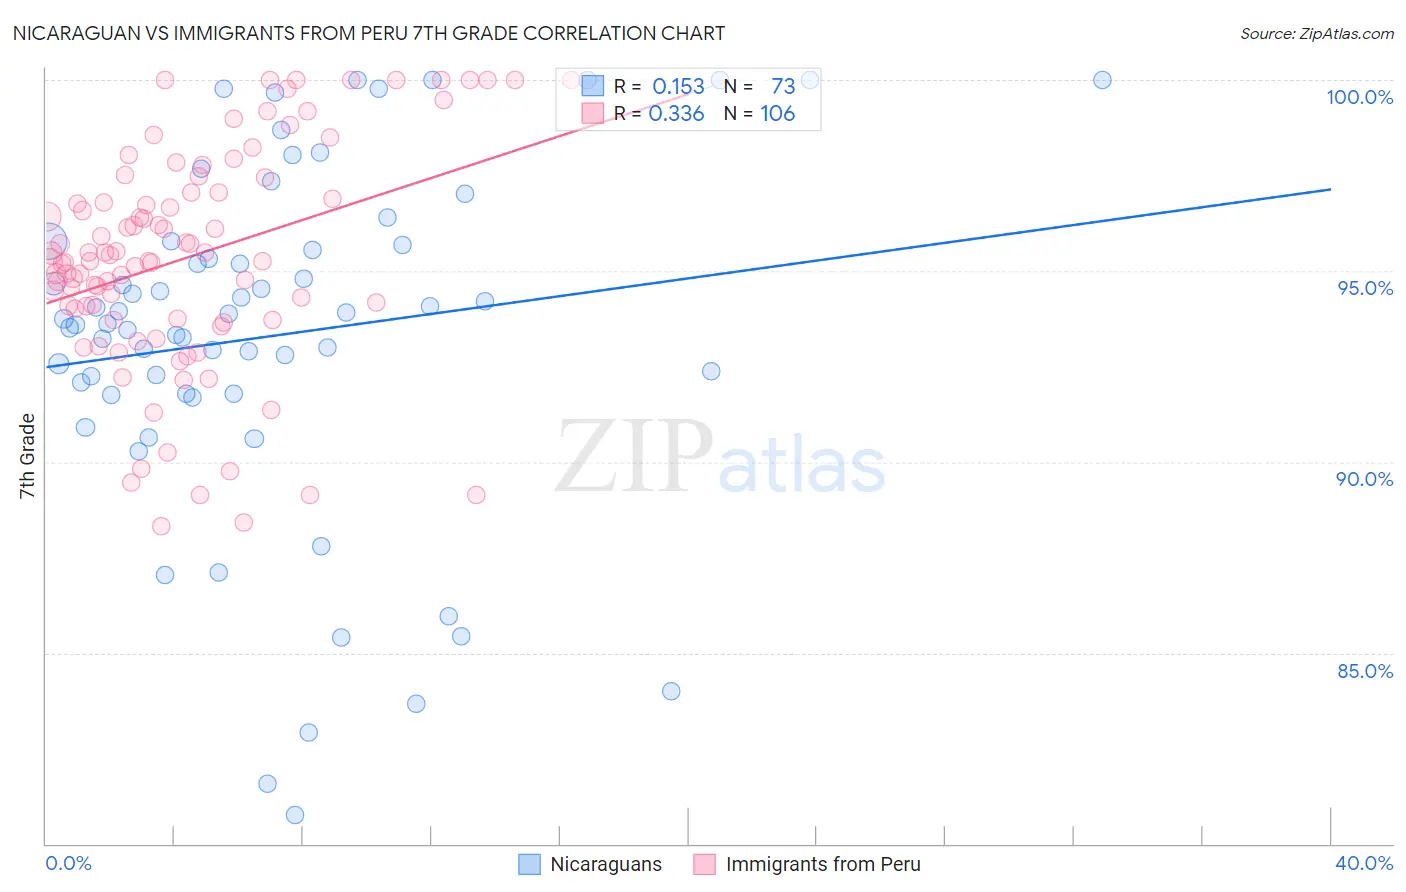
Nicaraguan vs Immigrants from Peru 7th Grade Correlation Chart
The statistical analysis conducted on geographies consisting of 285,711,651 people shows a poor positive correlation between the proportion of Nicaraguans and percentage of population with at least 7th grade education in the United States with a correlation coefficient (R) of 0.153 and weighted average of 93.5%. Similarly, the statistical analysis conducted on geographies consisting of 328,685,851 people shows a mild positive correlation between the proportion of Immigrants from Peru and percentage of population with at least 7th grade education in the United States with a correlation coefficient (R) of 0.336 and weighted average of 94.9%, a difference of 1.5%.
7th Grade Correlation Summary
| Measurement | Nicaraguan | Immigrants from Peru |
| Minimum | 80.8% | 88.3% |
| Maximum | 100.0% | 100.0% |
| Range | 19.2% | 11.7% |
| Mean | 93.3% | 95.4% |
| Median | 93.7% | 95.3% |
| Interquartile 25% (IQ1) | 91.8% | 93.7% |
| Interquartile 75% (IQ3) | 95.7% | 97.1% |
| Interquartile Range (IQR) | 3.9% | 3.3% |
| Standard Deviation (Sample) | 4.5% | 2.9% |
| Standard Deviation (Population) | 4.5% | 2.9% |
Similar Demographics by 7th Grade
Demographics Similar to Nicaraguans by 7th Grade
In terms of 7th grade, the demographic groups most similar to Nicaraguans are Belizean (93.5%, a difference of 0.040%), Immigrants from Fiji (93.5%, a difference of 0.080%), Immigrants from Belize (93.4%, a difference of 0.11%), Dominican (93.3%, a difference of 0.13%), and Central American Indian (93.3%, a difference of 0.20%).
| Demographics | Rating | Rank | 7th Grade |
| Vietnamese | 0.0 /100 | #315 | Tragic 93.9% |
| Immigrants | Vietnam | 0.0 /100 | #316 | Tragic 93.9% |
| Immigrants | Cuba | 0.0 /100 | #317 | Tragic 93.8% |
| Immigrants | Ecuador | 0.0 /100 | #318 | Tragic 93.7% |
| Immigrants | Cambodia | 0.0 /100 | #319 | Tragic 93.7% |
| Immigrants | Fiji | 0.0 /100 | #320 | Tragic 93.5% |
| Belizeans | 0.0 /100 | #321 | Tragic 93.5% |
| Nicaraguans | 0.0 /100 | #322 | Tragic 93.5% |
| Immigrants | Belize | 0.0 /100 | #323 | Tragic 93.4% |
| Dominicans | 0.0 /100 | #324 | Tragic 93.3% |
| Central American Indians | 0.0 /100 | #325 | Tragic 93.3% |
| Nepalese | 0.0 /100 | #326 | Tragic 93.2% |
| Immigrants | Cabo Verde | 0.0 /100 | #327 | Tragic 93.1% |
| Immigrants | Nicaragua | 0.0 /100 | #328 | Tragic 93.0% |
| Immigrants | Azores | 0.0 /100 | #329 | Tragic 93.0% |
Demographics Similar to Immigrants from Peru by 7th Grade
In terms of 7th grade, the demographic groups most similar to Immigrants from Peru are Immigrants from Philippines (94.9%, a difference of 0.010%), British West Indian (94.8%, a difference of 0.020%), Taiwanese (94.8%, a difference of 0.030%), Malaysian (94.8%, a difference of 0.050%), and Armenian (95.0%, a difference of 0.090%).
| Demographics | Rating | Rank | 7th Grade |
| Immigrants | St. Vincent and the Grenadines | 0.1 /100 | #280 | Tragic 95.0% |
| Tohono O'odham | 0.1 /100 | #281 | Tragic 95.0% |
| Immigrants | Bolivia | 0.1 /100 | #282 | Tragic 95.0% |
| Immigrants | Barbados | 0.1 /100 | #283 | Tragic 95.0% |
| Armenians | 0.1 /100 | #284 | Tragic 95.0% |
| Immigrants | Eritrea | 0.1 /100 | #285 | Tragic 94.9% |
| Immigrants | Philippines | 0.0 /100 | #286 | Tragic 94.9% |
| Immigrants | Peru | 0.0 /100 | #287 | Tragic 94.9% |
| British West Indians | 0.0 /100 | #288 | Tragic 94.8% |
| Taiwanese | 0.0 /100 | #289 | Tragic 94.8% |
| Malaysians | 0.0 /100 | #290 | Tragic 94.8% |
| Immigrants | Grenada | 0.0 /100 | #291 | Tragic 94.8% |
| Immigrants | West Indies | 0.0 /100 | #292 | Tragic 94.8% |
| Fijians | 0.0 /100 | #293 | Tragic 94.7% |
| Haitians | 0.0 /100 | #294 | Tragic 94.7% |