Romanian vs Immigrants from Lebanon Associate's Degree
COMPARE
Romanian
Immigrants from Lebanon
Associate's Degree
Associate's Degree Comparison
Romanians
Immigrants from Lebanon
49.7%
ASSOCIATE'S DEGREE
98.0/ 100
METRIC RATING
96th/ 347
METRIC RANK
50.5%
ASSOCIATE'S DEGREE
99.1/ 100
METRIC RATING
77th/ 347
METRIC RANK
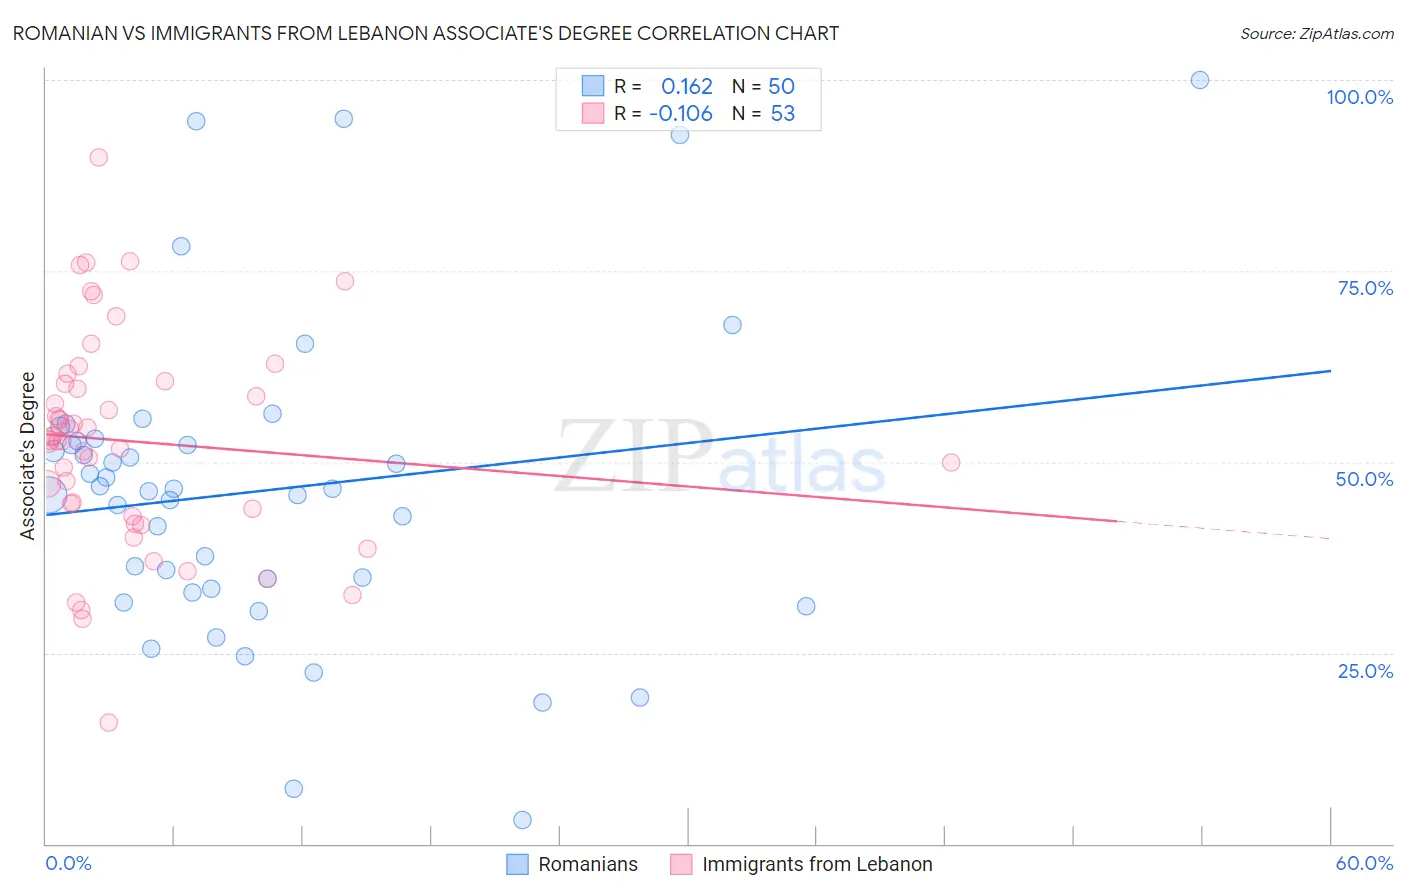
Romanian vs Immigrants from Lebanon Associate's Degree Correlation Chart
The statistical analysis conducted on geographies consisting of 377,869,565 people shows a poor positive correlation between the proportion of Romanians and percentage of population with at least associate's degree education in the United States with a correlation coefficient (R) of 0.162 and weighted average of 49.7%. Similarly, the statistical analysis conducted on geographies consisting of 217,164,247 people shows a poor negative correlation between the proportion of Immigrants from Lebanon and percentage of population with at least associate's degree education in the United States with a correlation coefficient (R) of -0.106 and weighted average of 50.5%, a difference of 1.5%.
Associate's Degree Correlation Summary
| Measurement | Romanian | Immigrants from Lebanon |
| Minimum | 3.1% | 15.9% |
| Maximum | 100.0% | 89.8% |
| Range | 96.9% | 73.9% |
| Mean | 46.2% | 52.7% |
| Median | 46.3% | 52.8% |
| Interquartile 25% (IQ1) | 33.3% | 43.4% |
| Interquartile 75% (IQ3) | 52.7% | 60.5% |
| Interquartile Range (IQR) | 19.4% | 17.1% |
| Standard Deviation (Sample) | 20.5% | 14.1% |
| Standard Deviation (Population) | 20.3% | 13.9% |
Demographics Similar to Romanians and Immigrants from Lebanon by Associate's Degree
In terms of associate's degree, the demographic groups most similar to Romanians are Immigrants from England (49.7%, a difference of 0.010%), Laotian (49.9%, a difference of 0.40%), Immigrants from Brazil (50.0%, a difference of 0.53%), Immigrants from North America (50.1%, a difference of 0.69%), and Immigrants from Western Asia (50.1%, a difference of 0.71%). Similarly, the demographic groups most similar to Immigrants from Lebanon are Immigrants from Zimbabwe (50.5%, a difference of 0.030%), Immigrants from Eastern Europe (50.5%, a difference of 0.040%), Ethiopian (50.4%, a difference of 0.060%), Armenian (50.4%, a difference of 0.090%), and Maltese (50.4%, a difference of 0.16%).
| Demographics | Rating | Rank | Associate's Degree |
| Immigrants | Zimbabwe | 99.2 /100 | #76 | Exceptional 50.5% |
| Immigrants | Lebanon | 99.1 /100 | #77 | Exceptional 50.5% |
| Immigrants | Eastern Europe | 99.1 /100 | #78 | Exceptional 50.5% |
| Ethiopians | 99.1 /100 | #79 | Exceptional 50.4% |
| Armenians | 99.1 /100 | #80 | Exceptional 50.4% |
| Maltese | 99.1 /100 | #81 | Exceptional 50.4% |
| Greeks | 98.9 /100 | #82 | Exceptional 50.3% |
| Immigrants | Uzbekistan | 98.9 /100 | #83 | Exceptional 50.3% |
| Immigrants | Hungary | 98.9 /100 | #84 | Exceptional 50.2% |
| Immigrants | Egypt | 98.9 /100 | #85 | Exceptional 50.2% |
| Immigrants | Croatia | 98.9 /100 | #86 | Exceptional 50.2% |
| Immigrants | Moldova | 98.8 /100 | #87 | Exceptional 50.2% |
| Immigrants | Canada | 98.7 /100 | #88 | Exceptional 50.1% |
| Immigrants | Western Europe | 98.7 /100 | #89 | Exceptional 50.1% |
| Immigrants | Ethiopia | 98.7 /100 | #90 | Exceptional 50.1% |
| Immigrants | Western Asia | 98.7 /100 | #91 | Exceptional 50.1% |
| Immigrants | North America | 98.7 /100 | #92 | Exceptional 50.1% |
| Immigrants | Brazil | 98.5 /100 | #93 | Exceptional 50.0% |
| Laotians | 98.4 /100 | #94 | Exceptional 49.9% |
| Immigrants | England | 98.0 /100 | #95 | Exceptional 49.7% |
| Romanians | 98.0 /100 | #96 | Exceptional 49.7% |