Romanian vs Colville Associate's Degree
COMPARE
Romanian
Colville
Associate's Degree
Associate's Degree Comparison
Romanians
Colville
49.7%
ASSOCIATE'S DEGREE
98.0/ 100
METRIC RATING
96th/ 347
METRIC RANK
38.5%
ASSOCIATE'S DEGREE
0.0/ 100
METRIC RATING
302nd/ 347
METRIC RANK
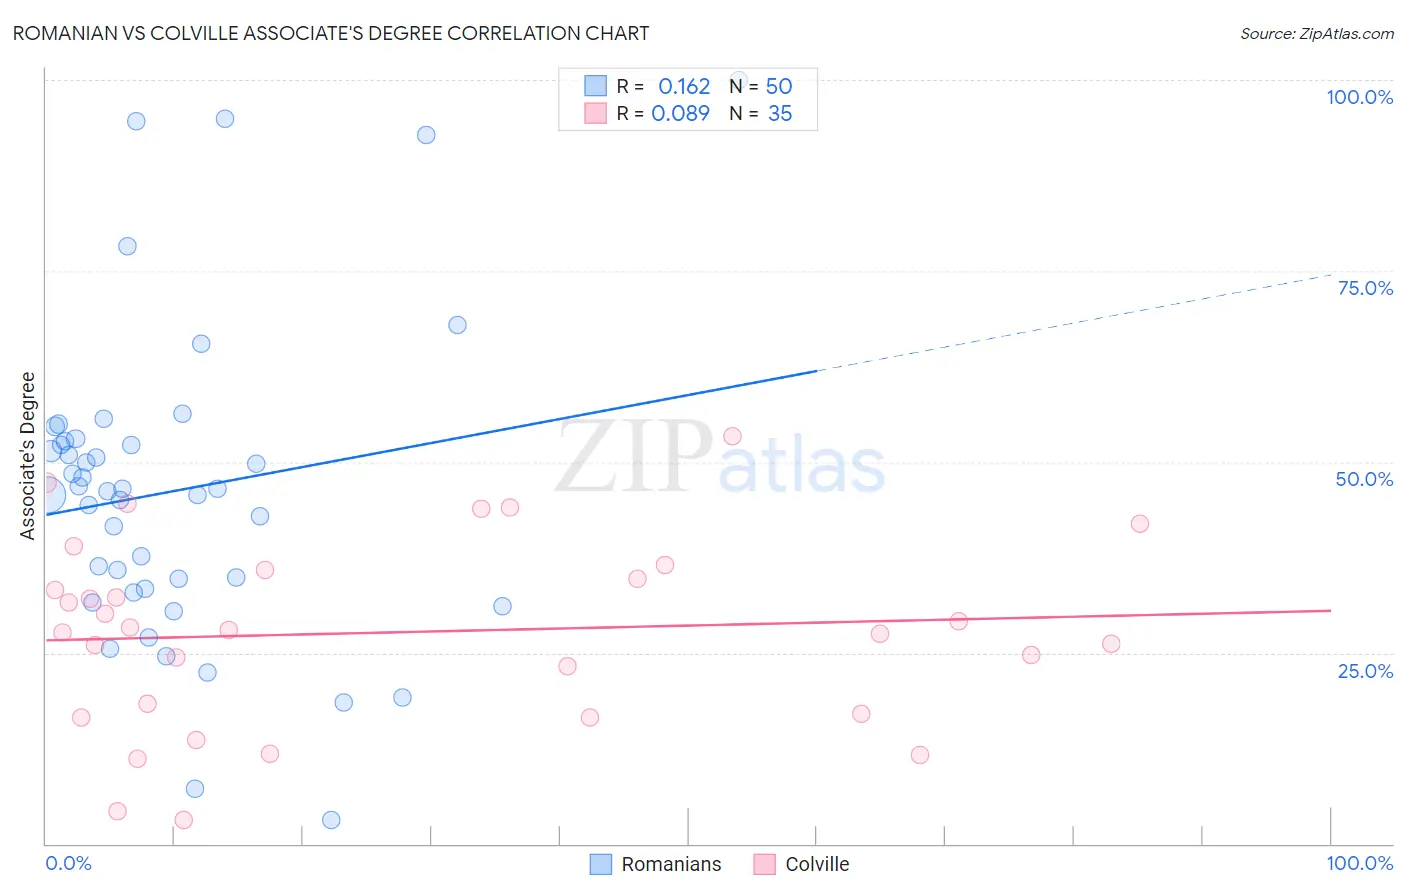
Romanian vs Colville Associate's Degree Correlation Chart
The statistical analysis conducted on geographies consisting of 377,869,565 people shows a poor positive correlation between the proportion of Romanians and percentage of population with at least associate's degree education in the United States with a correlation coefficient (R) of 0.162 and weighted average of 49.7%. Similarly, the statistical analysis conducted on geographies consisting of 34,684,410 people shows a slight positive correlation between the proportion of Colville and percentage of population with at least associate's degree education in the United States with a correlation coefficient (R) of 0.089 and weighted average of 38.5%, a difference of 29.1%.
Associate's Degree Correlation Summary
| Measurement | Romanian | Colville |
| Minimum | 3.1% | 3.2% |
| Maximum | 100.0% | 53.4% |
| Range | 96.9% | 50.2% |
| Mean | 46.2% | 27.7% |
| Median | 46.3% | 27.9% |
| Interquartile 25% (IQ1) | 33.3% | 17.1% |
| Interquartile 75% (IQ3) | 52.7% | 35.8% |
| Interquartile Range (IQR) | 19.4% | 18.7% |
| Standard Deviation (Sample) | 20.5% | 12.2% |
| Standard Deviation (Population) | 20.3% | 12.1% |
Similar Demographics by Associate's Degree
Demographics Similar to Romanians by Associate's Degree
In terms of associate's degree, the demographic groups most similar to Romanians are Immigrants from Ukraine (49.7%, a difference of 0.0%), Immigrants from England (49.7%, a difference of 0.010%), Immigrants from Northern Africa (49.7%, a difference of 0.090%), Macedonian (49.6%, a difference of 0.16%), and Immigrants from Nepal (49.5%, a difference of 0.38%).
| Demographics | Rating | Rank | Associate's Degree |
| Immigrants | Western Europe | 98.7 /100 | #89 | Exceptional 50.1% |
| Immigrants | Ethiopia | 98.7 /100 | #90 | Exceptional 50.1% |
| Immigrants | Western Asia | 98.7 /100 | #91 | Exceptional 50.1% |
| Immigrants | North America | 98.7 /100 | #92 | Exceptional 50.1% |
| Immigrants | Brazil | 98.5 /100 | #93 | Exceptional 50.0% |
| Laotians | 98.4 /100 | #94 | Exceptional 49.9% |
| Immigrants | England | 98.0 /100 | #95 | Exceptional 49.7% |
| Romanians | 98.0 /100 | #96 | Exceptional 49.7% |
| Immigrants | Ukraine | 98.0 /100 | #97 | Exceptional 49.7% |
| Immigrants | Northern Africa | 97.9 /100 | #98 | Exceptional 49.7% |
| Macedonians | 97.8 /100 | #99 | Exceptional 49.6% |
| Immigrants | Nepal | 97.5 /100 | #100 | Exceptional 49.5% |
| Northern Europeans | 97.3 /100 | #101 | Exceptional 49.5% |
| Chileans | 97.3 /100 | #102 | Exceptional 49.4% |
| Ukrainians | 97.1 /100 | #103 | Exceptional 49.4% |
Demographics Similar to Colville by Associate's Degree
In terms of associate's degree, the demographic groups most similar to Colville are Guatemalan (38.5%, a difference of 0.090%), Sioux (38.5%, a difference of 0.14%), Tsimshian (38.6%, a difference of 0.15%), Chickasaw (38.6%, a difference of 0.20%), and Immigrants from Honduras (38.5%, a difference of 0.21%).
| Demographics | Rating | Rank | Associate's Degree |
| Hondurans | 0.0 /100 | #295 | Tragic 38.9% |
| Cherokee | 0.0 /100 | #296 | Tragic 38.9% |
| Cape Verdeans | 0.0 /100 | #297 | Tragic 38.8% |
| Cheyenne | 0.0 /100 | #298 | Tragic 38.7% |
| Ute | 0.0 /100 | #299 | Tragic 38.6% |
| Chickasaw | 0.0 /100 | #300 | Tragic 38.6% |
| Tsimshian | 0.0 /100 | #301 | Tragic 38.6% |
| Colville | 0.0 /100 | #302 | Tragic 38.5% |
| Guatemalans | 0.0 /100 | #303 | Tragic 38.5% |
| Sioux | 0.0 /100 | #304 | Tragic 38.5% |
| Immigrants | Honduras | 0.0 /100 | #305 | Tragic 38.5% |
| Shoshone | 0.0 /100 | #306 | Tragic 38.4% |
| Immigrants | El Salvador | 0.0 /100 | #307 | Tragic 38.4% |
| Mexican American Indians | 0.0 /100 | #308 | Tragic 38.2% |
| Immigrants | Guatemala | 0.0 /100 | #309 | Tragic 38.1% |