Puget Sound Salish vs Immigrants from Zimbabwe 2nd Grade
COMPARE
Puget Sound Salish
Immigrants from Zimbabwe
2nd Grade
2nd Grade Comparison
Puget Sound Salish
Immigrants from Zimbabwe
98.2%
2ND GRADE
98.0/ 100
METRIC RATING
101st/ 347
METRIC RANK
98.1%
2ND GRADE
94.4/ 100
METRIC RATING
121st/ 347
METRIC RANK
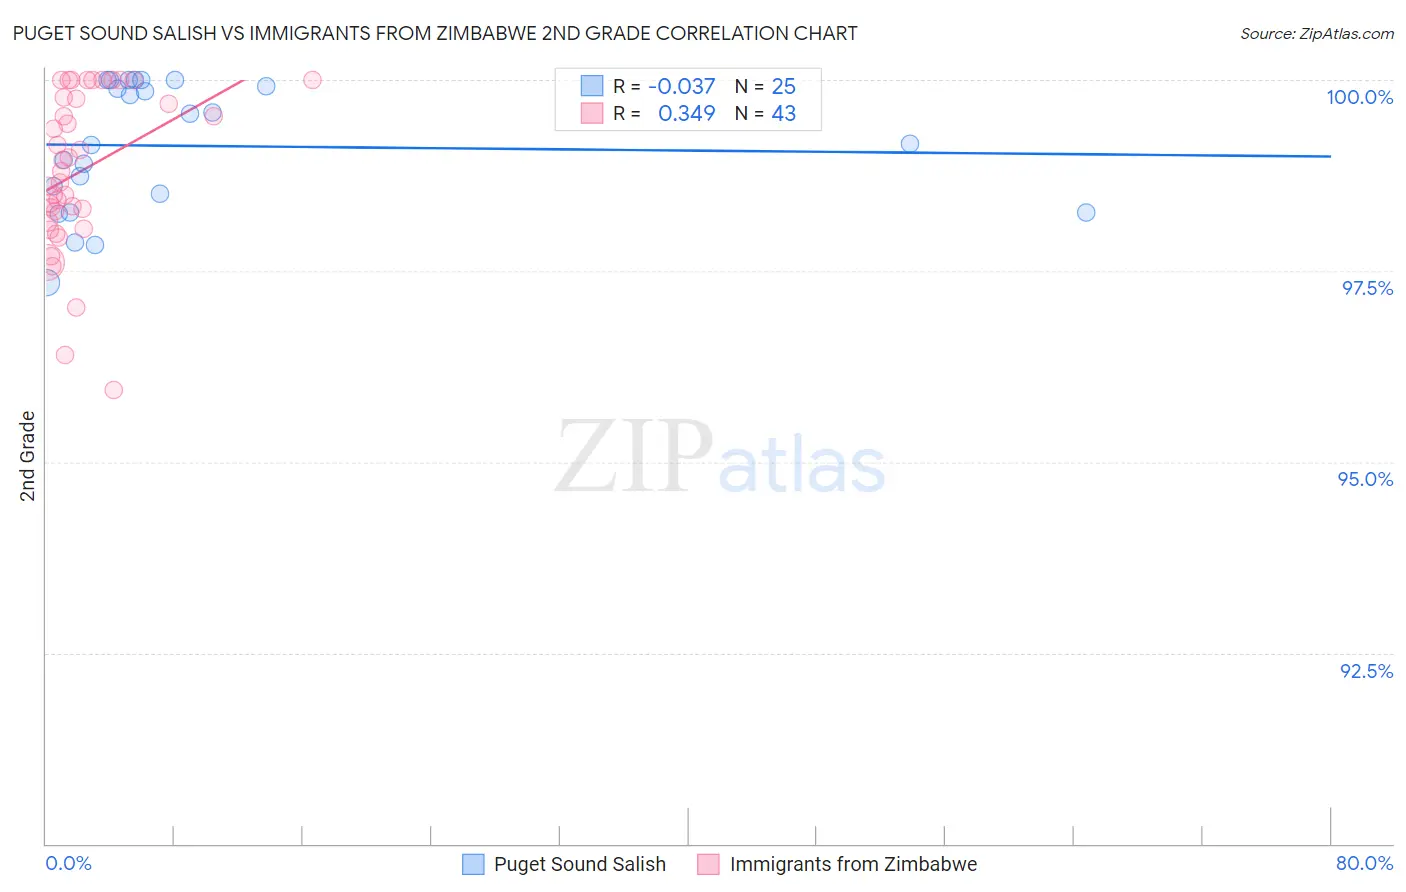
Puget Sound Salish vs Immigrants from Zimbabwe 2nd Grade Correlation Chart
The statistical analysis conducted on geographies consisting of 46,155,746 people shows no correlation between the proportion of Puget Sound Salish and percentage of population with at least 2nd grade education in the United States with a correlation coefficient (R) of -0.037 and weighted average of 98.2%. Similarly, the statistical analysis conducted on geographies consisting of 117,756,150 people shows a mild positive correlation between the proportion of Immigrants from Zimbabwe and percentage of population with at least 2nd grade education in the United States with a correlation coefficient (R) of 0.349 and weighted average of 98.1%, a difference of 0.080%.
2nd Grade Correlation Summary
| Measurement | Puget Sound Salish | Immigrants from Zimbabwe |
| Minimum | 97.3% | 95.9% |
| Maximum | 100.0% | 100.0% |
| Range | 2.7% | 4.1% |
| Mean | 99.1% | 98.8% |
| Median | 99.2% | 98.8% |
| Interquartile 25% (IQ1) | 98.4% | 98.1% |
| Interquartile 75% (IQ3) | 100.0% | 99.8% |
| Interquartile Range (IQR) | 1.6% | 1.6% |
| Standard Deviation (Sample) | 0.83% | 1.0% |
| Standard Deviation (Population) | 0.82% | 1.0% |
Demographics Similar to Puget Sound Salish and Immigrants from Zimbabwe by 2nd Grade
In terms of 2nd grade, the demographic groups most similar to Puget Sound Salish are Cree (98.2%, a difference of 0.0%), Pima (98.2%, a difference of 0.010%), Turkish (98.2%, a difference of 0.020%), Yugoslavian (98.2%, a difference of 0.020%), and Bhutanese (98.1%, a difference of 0.020%). Similarly, the demographic groups most similar to Immigrants from Zimbabwe are Okinawan (98.1%, a difference of 0.010%), Spanish (98.1%, a difference of 0.020%), Ute (98.1%, a difference of 0.020%), Immigrants from France (98.1%, a difference of 0.020%), and Thai (98.1%, a difference of 0.020%).
| Demographics | Rating | Rank | 2nd Grade |
| Puget Sound Salish | 98.0 /100 | #101 | Exceptional 98.2% |
| Cree | 98.0 /100 | #102 | Exceptional 98.2% |
| Pima | 97.6 /100 | #103 | Exceptional 98.2% |
| Turks | 97.6 /100 | #104 | Exceptional 98.2% |
| Yugoslavians | 97.5 /100 | #105 | Exceptional 98.2% |
| Bhutanese | 97.5 /100 | #106 | Exceptional 98.1% |
| German Russians | 97.4 /100 | #107 | Exceptional 98.1% |
| Immigrants | Switzerland | 97.3 /100 | #108 | Exceptional 98.1% |
| Basques | 97.2 /100 | #109 | Exceptional 98.1% |
| Immigrants | Singapore | 97.0 /100 | #110 | Exceptional 98.1% |
| Immigrants | Czechoslovakia | 96.9 /100 | #111 | Exceptional 98.1% |
| Colville | 96.6 /100 | #112 | Exceptional 98.1% |
| Immigrants | Norway | 96.5 /100 | #113 | Exceptional 98.1% |
| Immigrants | Latvia | 96.4 /100 | #114 | Exceptional 98.1% |
| Iranians | 95.9 /100 | #115 | Exceptional 98.1% |
| Spanish | 95.8 /100 | #116 | Exceptional 98.1% |
| Ute | 95.7 /100 | #117 | Exceptional 98.1% |
| Immigrants | France | 95.6 /100 | #118 | Exceptional 98.1% |
| Thais | 95.3 /100 | #119 | Exceptional 98.1% |
| Okinawans | 94.9 /100 | #120 | Exceptional 98.1% |
| Immigrants | Zimbabwe | 94.4 /100 | #121 | Exceptional 98.1% |