Immigrants from Colombia vs Immigrants from Zimbabwe 2nd Grade
COMPARE
Immigrants from Colombia
Immigrants from Zimbabwe
2nd Grade
2nd Grade Comparison
Immigrants from Colombia
Immigrants from Zimbabwe
97.5%
2ND GRADE
0.5/ 100
METRIC RATING
257th/ 347
METRIC RANK
98.1%
2ND GRADE
94.4/ 100
METRIC RATING
121st/ 347
METRIC RANK
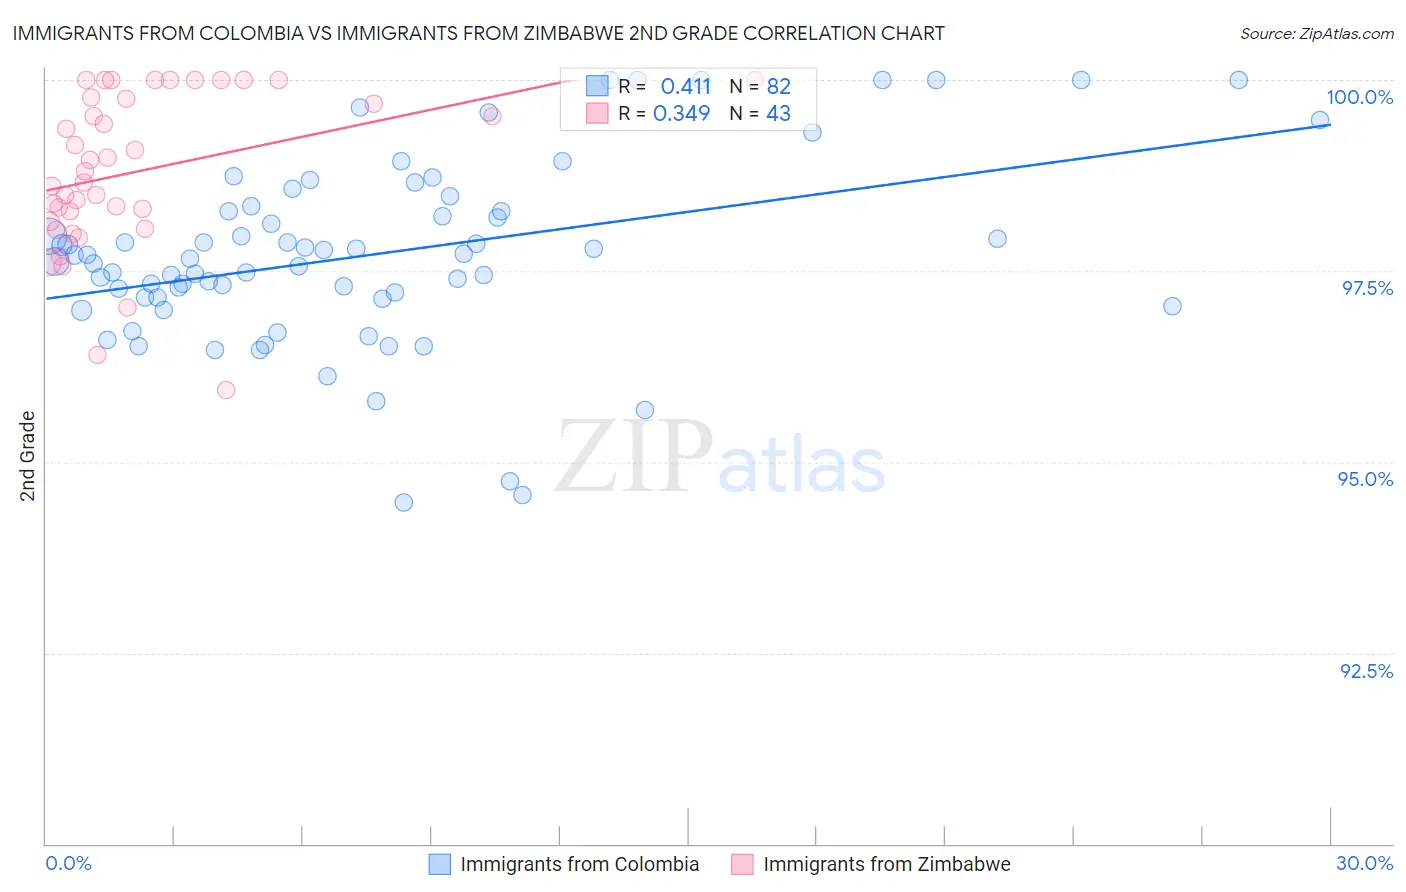
Immigrants from Colombia vs Immigrants from Zimbabwe 2nd Grade Correlation Chart
The statistical analysis conducted on geographies consisting of 378,643,693 people shows a moderate positive correlation between the proportion of Immigrants from Colombia and percentage of population with at least 2nd grade education in the United States with a correlation coefficient (R) of 0.411 and weighted average of 97.5%. Similarly, the statistical analysis conducted on geographies consisting of 117,756,150 people shows a mild positive correlation between the proportion of Immigrants from Zimbabwe and percentage of population with at least 2nd grade education in the United States with a correlation coefficient (R) of 0.349 and weighted average of 98.1%, a difference of 0.63%.
2nd Grade Correlation Summary
| Measurement | Immigrants from Colombia | Immigrants from Zimbabwe |
| Minimum | 94.5% | 95.9% |
| Maximum | 100.0% | 100.0% |
| Range | 5.5% | 4.1% |
| Mean | 97.7% | 98.8% |
| Median | 97.7% | 98.8% |
| Interquartile 25% (IQ1) | 97.1% | 98.1% |
| Interquartile 75% (IQ3) | 98.3% | 99.8% |
| Interquartile Range (IQR) | 1.1% | 1.6% |
| Standard Deviation (Sample) | 1.2% | 1.0% |
| Standard Deviation (Population) | 1.2% | 1.0% |
Similar Demographics by 2nd Grade
Demographics Similar to Immigrants from Colombia by 2nd Grade
In terms of 2nd grade, the demographic groups most similar to Immigrants from Colombia are Jamaican (97.5%, a difference of 0.0%), Indian (Asian) (97.5%, a difference of 0.010%), Immigrants from Congo (97.5%, a difference of 0.010%), Yaqui (97.5%, a difference of 0.010%), and Fijian (97.5%, a difference of 0.010%).
| Demographics | Rating | Rank | 2nd Grade |
| Peruvians | 0.9 /100 | #250 | Tragic 97.5% |
| Immigrants | Africa | 0.8 /100 | #251 | Tragic 97.5% |
| Immigrants | Asia | 0.7 /100 | #252 | Tragic 97.5% |
| Puerto Ricans | 0.7 /100 | #253 | Tragic 97.5% |
| Indians (Asian) | 0.6 /100 | #254 | Tragic 97.5% |
| Immigrants | Congo | 0.6 /100 | #255 | Tragic 97.5% |
| Jamaicans | 0.6 /100 | #256 | Tragic 97.5% |
| Immigrants | Colombia | 0.5 /100 | #257 | Tragic 97.5% |
| Yaqui | 0.5 /100 | #258 | Tragic 97.5% |
| Fijians | 0.5 /100 | #259 | Tragic 97.5% |
| Assyrians/Chaldeans/Syriacs | 0.5 /100 | #260 | Tragic 97.5% |
| Armenians | 0.5 /100 | #261 | Tragic 97.5% |
| Taiwanese | 0.4 /100 | #262 | Tragic 97.4% |
| Immigrants | Ethiopia | 0.4 /100 | #263 | Tragic 97.4% |
| Immigrants | Liberia | 0.4 /100 | #264 | Tragic 97.4% |
Demographics Similar to Immigrants from Zimbabwe by 2nd Grade
In terms of 2nd grade, the demographic groups most similar to Immigrants from Zimbabwe are Lebanese (98.1%, a difference of 0.0%), Immigrants from Japan (98.1%, a difference of 0.0%), Menominee (98.1%, a difference of 0.0%), Iroquois (98.1%, a difference of 0.0%), and Okinawan (98.1%, a difference of 0.010%).
| Demographics | Rating | Rank | 2nd Grade |
| Immigrants | Latvia | 96.4 /100 | #114 | Exceptional 98.1% |
| Iranians | 95.9 /100 | #115 | Exceptional 98.1% |
| Spanish | 95.8 /100 | #116 | Exceptional 98.1% |
| Ute | 95.7 /100 | #117 | Exceptional 98.1% |
| Immigrants | France | 95.6 /100 | #118 | Exceptional 98.1% |
| Thais | 95.3 /100 | #119 | Exceptional 98.1% |
| Okinawans | 94.9 /100 | #120 | Exceptional 98.1% |
| Immigrants | Zimbabwe | 94.4 /100 | #121 | Exceptional 98.1% |
| Lebanese | 94.2 /100 | #122 | Exceptional 98.1% |
| Immigrants | Japan | 94.1 /100 | #123 | Exceptional 98.1% |
| Menominee | 94.1 /100 | #124 | Exceptional 98.1% |
| Iroquois | 94.1 /100 | #125 | Exceptional 98.1% |
| Syrians | 94.0 /100 | #126 | Exceptional 98.1% |
| Immigrants | Saudi Arabia | 93.6 /100 | #127 | Exceptional 98.1% |
| Immigrants | Serbia | 92.3 /100 | #128 | Exceptional 98.1% |