Puget Sound Salish vs Immigrants from Zimbabwe Unemployment Among Ages 20 to 24 years
COMPARE
Puget Sound Salish
Immigrants from Zimbabwe
Unemployment Among Ages 20 to 24 years
Unemployment Among Ages 20 to 24 years Comparison
Puget Sound Salish
Immigrants from Zimbabwe
10.9%
UNEMPLOYMENT AMONG AGES 20 TO 24 YEARS
0.2/ 100
METRIC RATING
261st/ 347
METRIC RANK
9.5%
UNEMPLOYMENT AMONG AGES 20 TO 24 YEARS
100.0/ 100
METRIC RATING
27th/ 347
METRIC RANK
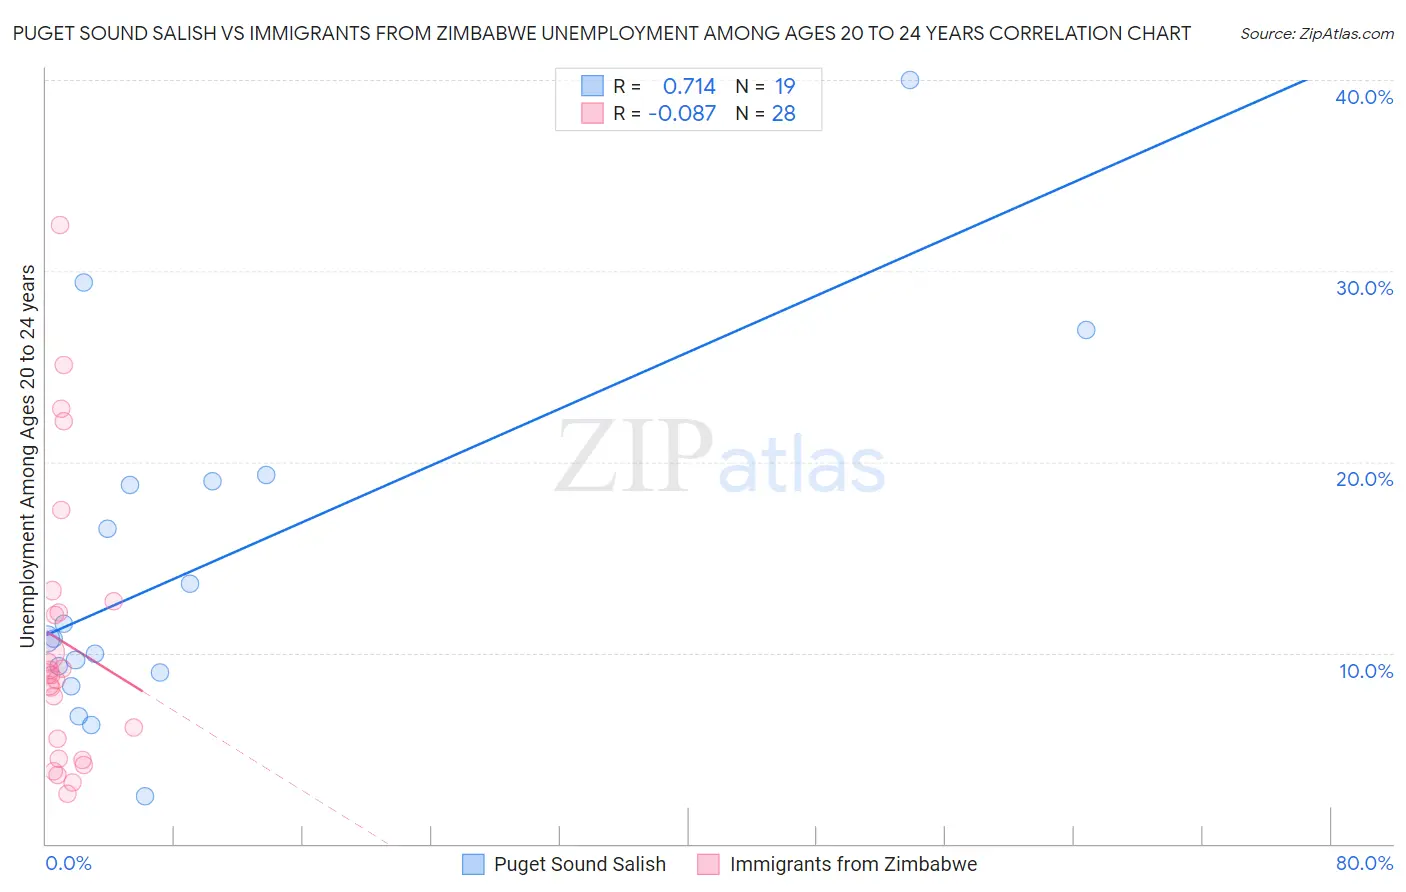
Puget Sound Salish vs Immigrants from Zimbabwe Unemployment Among Ages 20 to 24 years Correlation Chart
The statistical analysis conducted on geographies consisting of 45,634,421 people shows a strong positive correlation between the proportion of Puget Sound Salish and unemployment rate among population between the ages 20 and 24 in the United States with a correlation coefficient (R) of 0.714 and weighted average of 10.9%. Similarly, the statistical analysis conducted on geographies consisting of 116,782,368 people shows a slight negative correlation between the proportion of Immigrants from Zimbabwe and unemployment rate among population between the ages 20 and 24 in the United States with a correlation coefficient (R) of -0.087 and weighted average of 9.5%, a difference of 14.6%.
Unemployment Among Ages 20 to 24 years Correlation Summary
| Measurement | Puget Sound Salish | Immigrants from Zimbabwe |
| Minimum | 2.5% | 2.6% |
| Maximum | 40.0% | 32.4% |
| Range | 37.5% | 29.8% |
| Mean | 14.6% | 10.6% |
| Median | 10.8% | 8.9% |
| Interquartile 25% (IQ1) | 9.0% | 5.0% |
| Interquartile 75% (IQ3) | 19.0% | 12.4% |
| Interquartile Range (IQR) | 10.0% | 7.4% |
| Standard Deviation (Sample) | 9.3% | 7.3% |
| Standard Deviation (Population) | 9.0% | 7.2% |
Similar Demographics by Unemployment Among Ages 20 to 24 years
Demographics Similar to Puget Sound Salish by Unemployment Among Ages 20 to 24 years
In terms of unemployment among ages 20 to 24 years, the demographic groups most similar to Puget Sound Salish are Immigrants from Lebanon (10.9%, a difference of 0.24%), Panamanian (10.9%, a difference of 0.27%), Dutch West Indian (10.9%, a difference of 0.37%), Immigrants from Western Asia (10.9%, a difference of 0.44%), and Immigrants from Latin America (11.0%, a difference of 0.46%).
| Demographics | Rating | Rank | Unemployment Among Ages 20 to 24 years |
| Liberians | 0.3 /100 | #254 | Tragic 10.8% |
| Immigrants | Israel | 0.3 /100 | #255 | Tragic 10.8% |
| Immigrants | Bahamas | 0.3 /100 | #256 | Tragic 10.9% |
| Immigrants | Western Asia | 0.3 /100 | #257 | Tragic 10.9% |
| Dutch West Indians | 0.3 /100 | #258 | Tragic 10.9% |
| Panamanians | 0.2 /100 | #259 | Tragic 10.9% |
| Immigrants | Lebanon | 0.2 /100 | #260 | Tragic 10.9% |
| Puget Sound Salish | 0.2 /100 | #261 | Tragic 10.9% |
| Immigrants | Latin America | 0.1 /100 | #262 | Tragic 11.0% |
| Marshallese | 0.1 /100 | #263 | Tragic 11.0% |
| Sub-Saharan Africans | 0.0 /100 | #264 | Tragic 11.1% |
| Immigrants | Ireland | 0.0 /100 | #265 | Tragic 11.1% |
| Immigrants | Liberia | 0.0 /100 | #266 | Tragic 11.1% |
| Immigrants | Greece | 0.0 /100 | #267 | Tragic 11.1% |
| Maltese | 0.0 /100 | #268 | Tragic 11.2% |
Demographics Similar to Immigrants from Zimbabwe by Unemployment Among Ages 20 to 24 years
In terms of unemployment among ages 20 to 24 years, the demographic groups most similar to Immigrants from Zimbabwe are Immigrants from Afghanistan (9.5%, a difference of 0.080%), Immigrants from North Macedonia (9.5%, a difference of 0.090%), Scandinavian (9.5%, a difference of 0.11%), Immigrants from Eastern Africa (9.5%, a difference of 0.19%), and Cambodian (9.5%, a difference of 0.24%).
| Demographics | Rating | Rank | Unemployment Among Ages 20 to 24 years |
| Osage | 100.0 /100 | #20 | Exceptional 9.4% |
| Immigrants | Bosnia and Herzegovina | 100.0 /100 | #21 | Exceptional 9.4% |
| Tongans | 100.0 /100 | #22 | Exceptional 9.4% |
| Immigrants | Nepal | 100.0 /100 | #23 | Exceptional 9.4% |
| Taiwanese | 100.0 /100 | #24 | Exceptional 9.4% |
| Immigrants | Eritrea | 100.0 /100 | #25 | Exceptional 9.5% |
| Swedes | 100.0 /100 | #26 | Exceptional 9.5% |
| Immigrants | Zimbabwe | 100.0 /100 | #27 | Exceptional 9.5% |
| Immigrants | Afghanistan | 100.0 /100 | #28 | Exceptional 9.5% |
| Immigrants | North Macedonia | 100.0 /100 | #29 | Exceptional 9.5% |
| Scandinavians | 100.0 /100 | #30 | Exceptional 9.5% |
| Immigrants | Eastern Africa | 100.0 /100 | #31 | Exceptional 9.5% |
| Cambodians | 100.0 /100 | #32 | Exceptional 9.5% |
| Australians | 100.0 /100 | #33 | Exceptional 9.6% |
| Yugoslavians | 100.0 /100 | #34 | Exceptional 9.6% |