Puget Sound Salish vs Immigrants from Moldova 2nd Grade
COMPARE
Puget Sound Salish
Immigrants from Moldova
2nd Grade
2nd Grade Comparison
Puget Sound Salish
Immigrants from Moldova
98.2%
2ND GRADE
98.0/ 100
METRIC RATING
101st/ 347
METRIC RANK
97.9%
2ND GRADE
72.9/ 100
METRIC RATING
150th/ 347
METRIC RANK
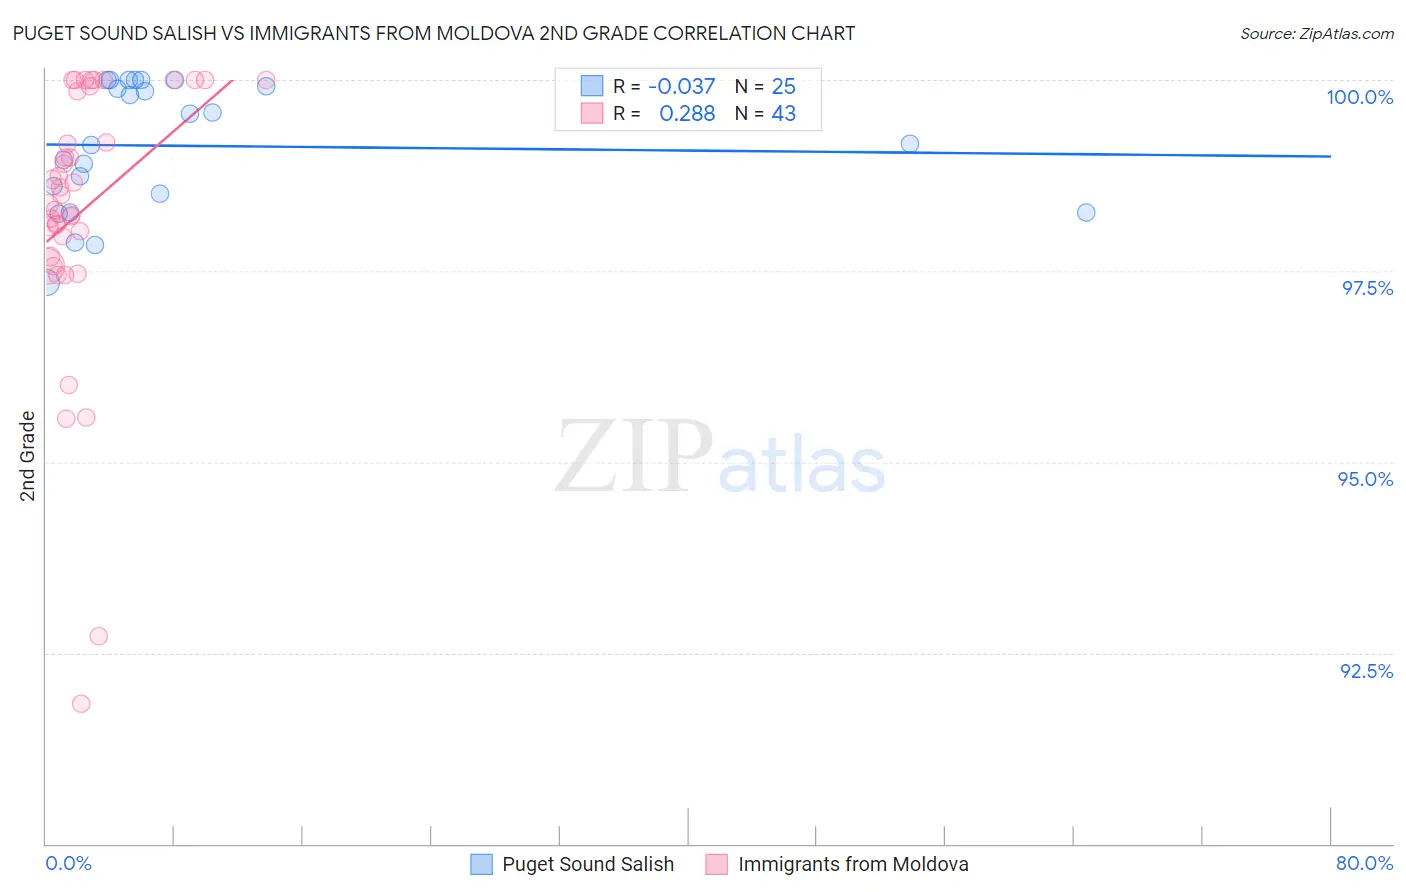
Puget Sound Salish vs Immigrants from Moldova 2nd Grade Correlation Chart
The statistical analysis conducted on geographies consisting of 46,155,746 people shows no correlation between the proportion of Puget Sound Salish and percentage of population with at least 2nd grade education in the United States with a correlation coefficient (R) of -0.037 and weighted average of 98.2%. Similarly, the statistical analysis conducted on geographies consisting of 124,398,501 people shows a weak positive correlation between the proportion of Immigrants from Moldova and percentage of population with at least 2nd grade education in the United States with a correlation coefficient (R) of 0.288 and weighted average of 97.9%, a difference of 0.23%.
2nd Grade Correlation Summary
| Measurement | Puget Sound Salish | Immigrants from Moldova |
| Minimum | 97.3% | 91.8% |
| Maximum | 100.0% | 100.0% |
| Range | 2.7% | 8.2% |
| Mean | 99.1% | 98.3% |
| Median | 99.2% | 98.5% |
| Interquartile 25% (IQ1) | 98.4% | 97.7% |
| Interquartile 75% (IQ3) | 100.0% | 99.9% |
| Interquartile Range (IQR) | 1.6% | 2.2% |
| Standard Deviation (Sample) | 0.83% | 1.8% |
| Standard Deviation (Population) | 0.82% | 1.8% |
Similar Demographics by 2nd Grade
Demographics Similar to Puget Sound Salish by 2nd Grade
In terms of 2nd grade, the demographic groups most similar to Puget Sound Salish are Immigrants from Ireland (98.2%, a difference of 0.0%), Romanian (98.2%, a difference of 0.0%), Cree (98.2%, a difference of 0.0%), Choctaw (98.2%, a difference of 0.010%), and Nonimmigrants (98.2%, a difference of 0.010%).
| Demographics | Rating | Rank | 2nd Grade |
| Immigrants | Germany | 98.6 /100 | #94 | Exceptional 98.2% |
| South Africans | 98.6 /100 | #95 | Exceptional 98.2% |
| Cypriots | 98.4 /100 | #96 | Exceptional 98.2% |
| Choctaw | 98.3 /100 | #97 | Exceptional 98.2% |
| Immigrants | Nonimmigrants | 98.3 /100 | #98 | Exceptional 98.2% |
| Immigrants | Ireland | 98.0 /100 | #99 | Exceptional 98.2% |
| Romanians | 98.0 /100 | #100 | Exceptional 98.2% |
| Puget Sound Salish | 98.0 /100 | #101 | Exceptional 98.2% |
| Cree | 98.0 /100 | #102 | Exceptional 98.2% |
| Pima | 97.6 /100 | #103 | Exceptional 98.2% |
| Turks | 97.6 /100 | #104 | Exceptional 98.2% |
| Yugoslavians | 97.5 /100 | #105 | Exceptional 98.2% |
| Bhutanese | 97.5 /100 | #106 | Exceptional 98.1% |
| German Russians | 97.4 /100 | #107 | Exceptional 98.1% |
| Immigrants | Switzerland | 97.3 /100 | #108 | Exceptional 98.1% |
Demographics Similar to Immigrants from Moldova by 2nd Grade
In terms of 2nd grade, the demographic groups most similar to Immigrants from Moldova are Apache (97.9%, a difference of 0.0%), Jordanian (98.0%, a difference of 0.010%), Soviet Union (97.9%, a difference of 0.010%), Immigrants from Israel (98.0%, a difference of 0.020%), and Immigrants from Greece (98.0%, a difference of 0.020%).
| Demographics | Rating | Rank | 2nd Grade |
| Alsatians | 80.5 /100 | #143 | Excellent 98.0% |
| Hmong | 80.0 /100 | #144 | Good 98.0% |
| Filipinos | 79.2 /100 | #145 | Good 98.0% |
| Immigrants | Israel | 78.0 /100 | #146 | Good 98.0% |
| Immigrants | Greece | 76.8 /100 | #147 | Good 98.0% |
| Jordanians | 74.5 /100 | #148 | Good 98.0% |
| Apache | 74.0 /100 | #149 | Good 97.9% |
| Immigrants | Moldova | 72.9 /100 | #150 | Good 97.9% |
| Soviet Union | 70.7 /100 | #151 | Good 97.9% |
| Immigrants | North Macedonia | 68.5 /100 | #152 | Good 97.9% |
| Immigrants | South Central Asia | 68.3 /100 | #153 | Good 97.9% |
| Marshallese | 67.7 /100 | #154 | Good 97.9% |
| French American Indians | 64.3 /100 | #155 | Good 97.9% |
| Dutch West Indians | 63.8 /100 | #156 | Good 97.9% |
| Venezuelans | 63.3 /100 | #157 | Good 97.9% |