Hungarian vs Immigrants from Zimbabwe 2nd Grade
COMPARE
Hungarian
Immigrants from Zimbabwe
2nd Grade
2nd Grade Comparison
Hungarians
Immigrants from Zimbabwe
98.4%
2ND GRADE
99.9/ 100
METRIC RATING
45th/ 347
METRIC RANK
98.1%
2ND GRADE
94.4/ 100
METRIC RATING
121st/ 347
METRIC RANK
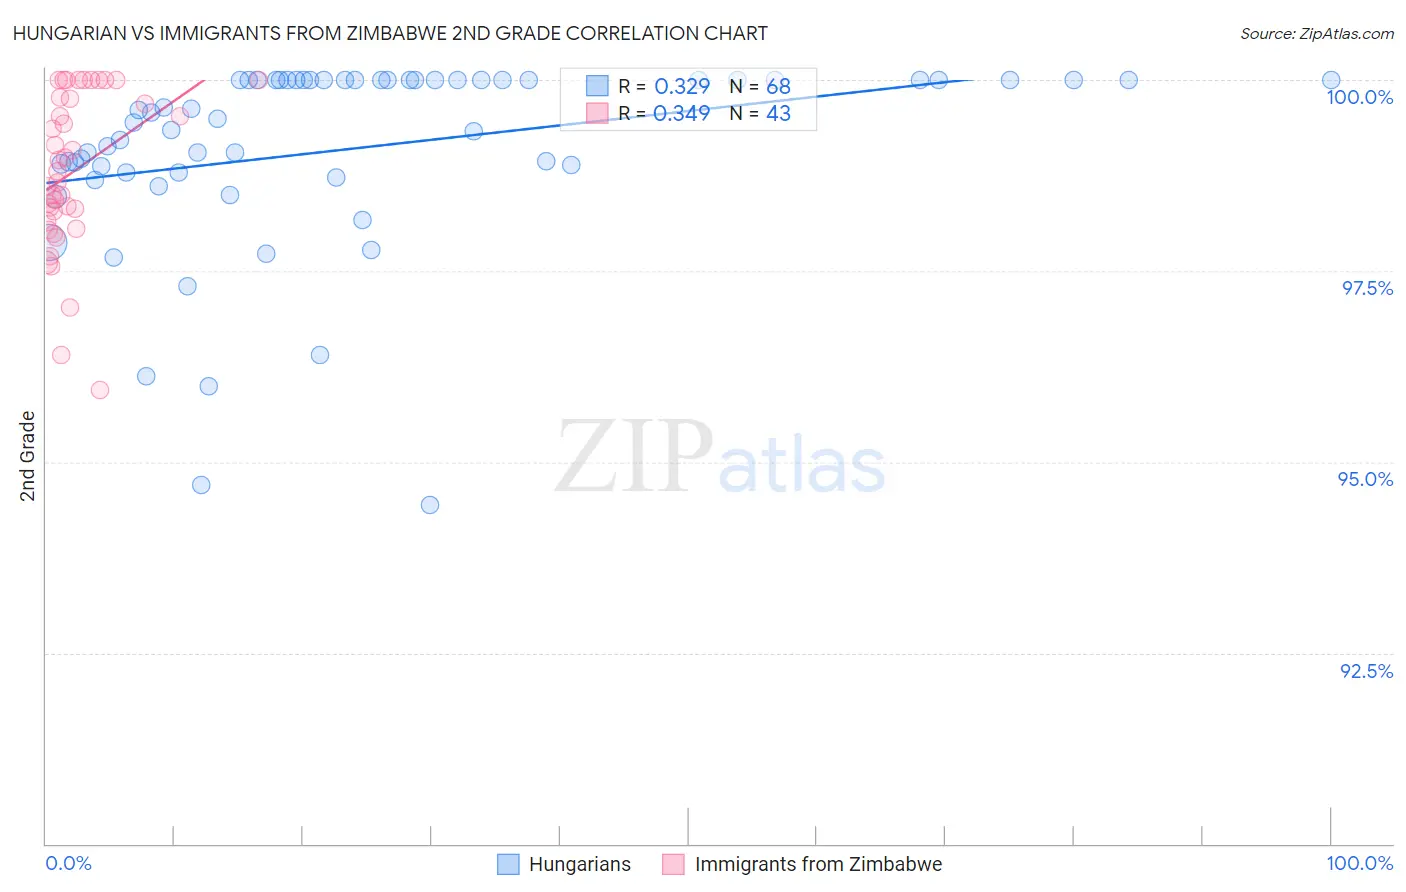
Hungarian vs Immigrants from Zimbabwe 2nd Grade Correlation Chart
The statistical analysis conducted on geographies consisting of 486,239,439 people shows a mild positive correlation between the proportion of Hungarians and percentage of population with at least 2nd grade education in the United States with a correlation coefficient (R) of 0.329 and weighted average of 98.4%. Similarly, the statistical analysis conducted on geographies consisting of 117,756,150 people shows a mild positive correlation between the proportion of Immigrants from Zimbabwe and percentage of population with at least 2nd grade education in the United States with a correlation coefficient (R) of 0.349 and weighted average of 98.1%, a difference of 0.31%.
2nd Grade Correlation Summary
| Measurement | Hungarian | Immigrants from Zimbabwe |
| Minimum | 94.4% | 95.9% |
| Maximum | 100.0% | 100.0% |
| Range | 5.6% | 4.1% |
| Mean | 99.1% | 98.8% |
| Median | 99.5% | 98.8% |
| Interquartile 25% (IQ1) | 98.8% | 98.1% |
| Interquartile 75% (IQ3) | 100.0% | 99.8% |
| Interquartile Range (IQR) | 1.2% | 1.6% |
| Standard Deviation (Sample) | 1.3% | 1.0% |
| Standard Deviation (Population) | 1.2% | 1.0% |
Similar Demographics by 2nd Grade
Demographics Similar to Hungarians by 2nd Grade
In terms of 2nd grade, the demographic groups most similar to Hungarians are Lumbee (98.4%, a difference of 0.010%), Ottawa (98.4%, a difference of 0.010%), Native Hawaiian (98.4%, a difference of 0.020%), Belgian (98.4%, a difference of 0.020%), and Northern European (98.4%, a difference of 0.020%).
| Demographics | Rating | Rank | 2nd Grade |
| Latvians | 99.9 /100 | #38 | Exceptional 98.4% |
| Chippewa | 99.9 /100 | #39 | Exceptional 98.4% |
| Luxembourgers | 99.9 /100 | #40 | Exceptional 98.4% |
| Eastern Europeans | 99.9 /100 | #41 | Exceptional 98.4% |
| Native Hawaiians | 99.9 /100 | #42 | Exceptional 98.4% |
| Belgians | 99.9 /100 | #43 | Exceptional 98.4% |
| Northern Europeans | 99.9 /100 | #44 | Exceptional 98.4% |
| Hungarians | 99.9 /100 | #45 | Exceptional 98.4% |
| Lumbee | 99.9 /100 | #46 | Exceptional 98.4% |
| Ottawa | 99.9 /100 | #47 | Exceptional 98.4% |
| Czechoslovakians | 99.9 /100 | #48 | Exceptional 98.4% |
| Celtics | 99.8 /100 | #49 | Exceptional 98.4% |
| Whites/Caucasians | 99.8 /100 | #50 | Exceptional 98.4% |
| Estonians | 99.8 /100 | #51 | Exceptional 98.4% |
| Australians | 99.8 /100 | #52 | Exceptional 98.4% |
Demographics Similar to Immigrants from Zimbabwe by 2nd Grade
In terms of 2nd grade, the demographic groups most similar to Immigrants from Zimbabwe are Lebanese (98.1%, a difference of 0.0%), Immigrants from Japan (98.1%, a difference of 0.0%), Menominee (98.1%, a difference of 0.0%), Iroquois (98.1%, a difference of 0.0%), and Okinawan (98.1%, a difference of 0.010%).
| Demographics | Rating | Rank | 2nd Grade |
| Immigrants | Latvia | 96.4 /100 | #114 | Exceptional 98.1% |
| Iranians | 95.9 /100 | #115 | Exceptional 98.1% |
| Spanish | 95.8 /100 | #116 | Exceptional 98.1% |
| Ute | 95.7 /100 | #117 | Exceptional 98.1% |
| Immigrants | France | 95.6 /100 | #118 | Exceptional 98.1% |
| Thais | 95.3 /100 | #119 | Exceptional 98.1% |
| Okinawans | 94.9 /100 | #120 | Exceptional 98.1% |
| Immigrants | Zimbabwe | 94.4 /100 | #121 | Exceptional 98.1% |
| Lebanese | 94.2 /100 | #122 | Exceptional 98.1% |
| Immigrants | Japan | 94.1 /100 | #123 | Exceptional 98.1% |
| Menominee | 94.1 /100 | #124 | Exceptional 98.1% |
| Iroquois | 94.1 /100 | #125 | Exceptional 98.1% |
| Syrians | 94.0 /100 | #126 | Exceptional 98.1% |
| Immigrants | Saudi Arabia | 93.6 /100 | #127 | Exceptional 98.1% |
| Immigrants | Serbia | 92.3 /100 | #128 | Exceptional 98.1% |