Immigrants from Croatia vs Dutch West Indian Master's Degree
COMPARE
Immigrants from Croatia
Dutch West Indian
Master's Degree
Master's Degree Comparison
Immigrants from Croatia
Dutch West Indians
17.3%
MASTER'S DEGREE
99.3/ 100
METRIC RATING
86th/ 347
METRIC RANK
10.6%
MASTER'S DEGREE
0.0/ 100
METRIC RATING
324th/ 347
METRIC RANK
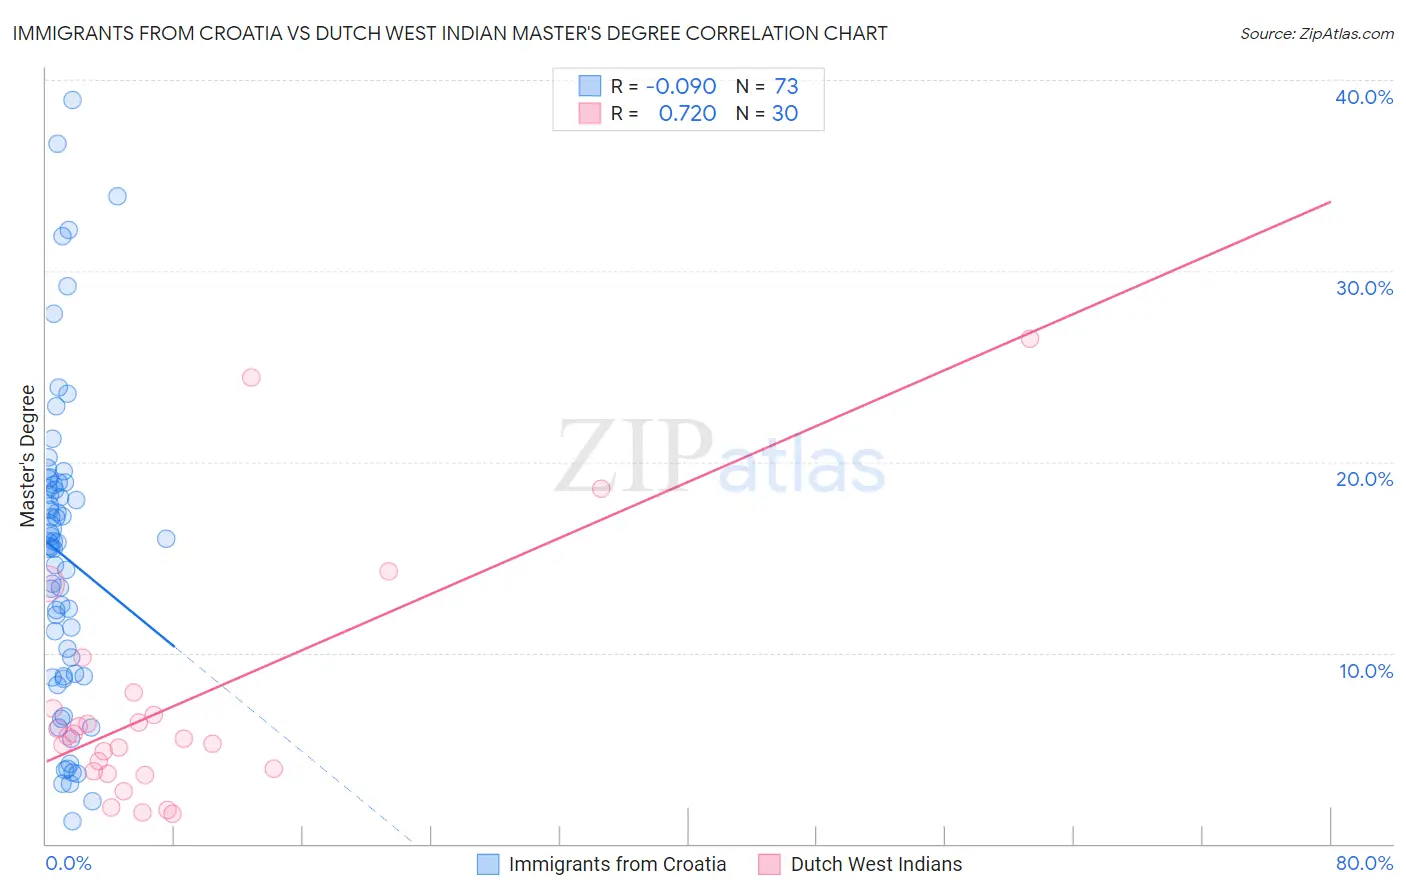
Immigrants from Croatia vs Dutch West Indian Master's Degree Correlation Chart
The statistical analysis conducted on geographies consisting of 132,554,836 people shows a slight negative correlation between the proportion of Immigrants from Croatia and percentage of population with at least master's degree education in the United States with a correlation coefficient (R) of -0.090 and weighted average of 17.3%. Similarly, the statistical analysis conducted on geographies consisting of 85,760,776 people shows a strong positive correlation between the proportion of Dutch West Indians and percentage of population with at least master's degree education in the United States with a correlation coefficient (R) of 0.720 and weighted average of 10.6%, a difference of 62.6%.
Master's Degree Correlation Summary
| Measurement | Immigrants from Croatia | Dutch West Indian |
| Minimum | 1.2% | 1.6% |
| Maximum | 39.0% | 26.5% |
| Range | 37.8% | 24.9% |
| Mean | 15.1% | 7.3% |
| Median | 15.7% | 5.5% |
| Interquartile 25% (IQ1) | 8.8% | 3.8% |
| Interquartile 75% (IQ3) | 18.8% | 7.1% |
| Interquartile Range (IQR) | 10.1% | 3.3% |
| Standard Deviation (Sample) | 8.2% | 6.2% |
| Standard Deviation (Population) | 8.1% | 6.1% |
Similar Demographics by Master's Degree
Demographics Similar to Immigrants from Croatia by Master's Degree
In terms of master's degree, the demographic groups most similar to Immigrants from Croatia are Maltese (17.3%, a difference of 0.10%), Immigrants from Brazil (17.4%, a difference of 0.41%), Immigrants from Canada (17.2%, a difference of 0.46%), Bhutanese (17.2%, a difference of 0.53%), and Immigrants from Egypt (17.2%, a difference of 0.55%).
| Demographics | Rating | Rank | Master's Degree |
| Immigrants | Lebanon | 99.6 /100 | #79 | Exceptional 17.5% |
| Carpatho Rusyns | 99.6 /100 | #80 | Exceptional 17.5% |
| Immigrants | Western Asia | 99.5 /100 | #81 | Exceptional 17.5% |
| Greeks | 99.5 /100 | #82 | Exceptional 17.5% |
| Immigrants | Zimbabwe | 99.5 /100 | #83 | Exceptional 17.4% |
| Immigrants | Scotland | 99.4 /100 | #84 | Exceptional 17.4% |
| Immigrants | Brazil | 99.4 /100 | #85 | Exceptional 17.4% |
| Immigrants | Croatia | 99.3 /100 | #86 | Exceptional 17.3% |
| Maltese | 99.3 /100 | #87 | Exceptional 17.3% |
| Immigrants | Canada | 99.2 /100 | #88 | Exceptional 17.2% |
| Bhutanese | 99.1 /100 | #89 | Exceptional 17.2% |
| Immigrants | Egypt | 99.1 /100 | #90 | Exceptional 17.2% |
| Romanians | 99.1 /100 | #91 | Exceptional 17.2% |
| Immigrants | North America | 99.1 /100 | #92 | Exceptional 17.2% |
| Immigrants | Italy | 99.1 /100 | #93 | Exceptional 17.2% |
Demographics Similar to Dutch West Indians by Master's Degree
In terms of master's degree, the demographic groups most similar to Dutch West Indians are Crow (10.6%, a difference of 0.040%), Sioux (10.7%, a difference of 0.44%), Pennsylvania German (10.7%, a difference of 1.1%), Inupiat (10.5%, a difference of 1.1%), and Creek (10.5%, a difference of 1.1%).
| Demographics | Rating | Rank | Master's Degree |
| Hopi | 0.0 /100 | #317 | Tragic 10.9% |
| Immigrants | Cuba | 0.0 /100 | #318 | Tragic 10.9% |
| Kiowa | 0.0 /100 | #319 | Tragic 10.8% |
| Immigrants | Micronesia | 0.0 /100 | #320 | Tragic 10.8% |
| Pennsylvania Germans | 0.0 /100 | #321 | Tragic 10.7% |
| Sioux | 0.0 /100 | #322 | Tragic 10.7% |
| Crow | 0.0 /100 | #323 | Tragic 10.6% |
| Dutch West Indians | 0.0 /100 | #324 | Tragic 10.6% |
| Inupiat | 0.0 /100 | #325 | Tragic 10.5% |
| Creek | 0.0 /100 | #326 | Tragic 10.5% |
| Paiute | 0.0 /100 | #327 | Tragic 10.5% |
| Bangladeshis | 0.0 /100 | #328 | Tragic 10.5% |
| Nepalese | 0.0 /100 | #329 | Tragic 10.5% |
| Fijians | 0.0 /100 | #330 | Tragic 10.3% |
| Pueblo | 0.0 /100 | #331 | Tragic 10.3% |