Puerto Rican vs Norwegian High School Diploma
COMPARE
Puerto Rican
Norwegian
High School Diploma
High School Diploma Comparison
Puerto Ricans
Norwegians
84.7%
HIGH SCHOOL DIPLOMA
0.0/ 100
METRIC RATING
315th/ 347
METRIC RANK
92.5%
HIGH SCHOOL DIPLOMA
100.0/ 100
METRIC RATING
1st/ 347
METRIC RANK
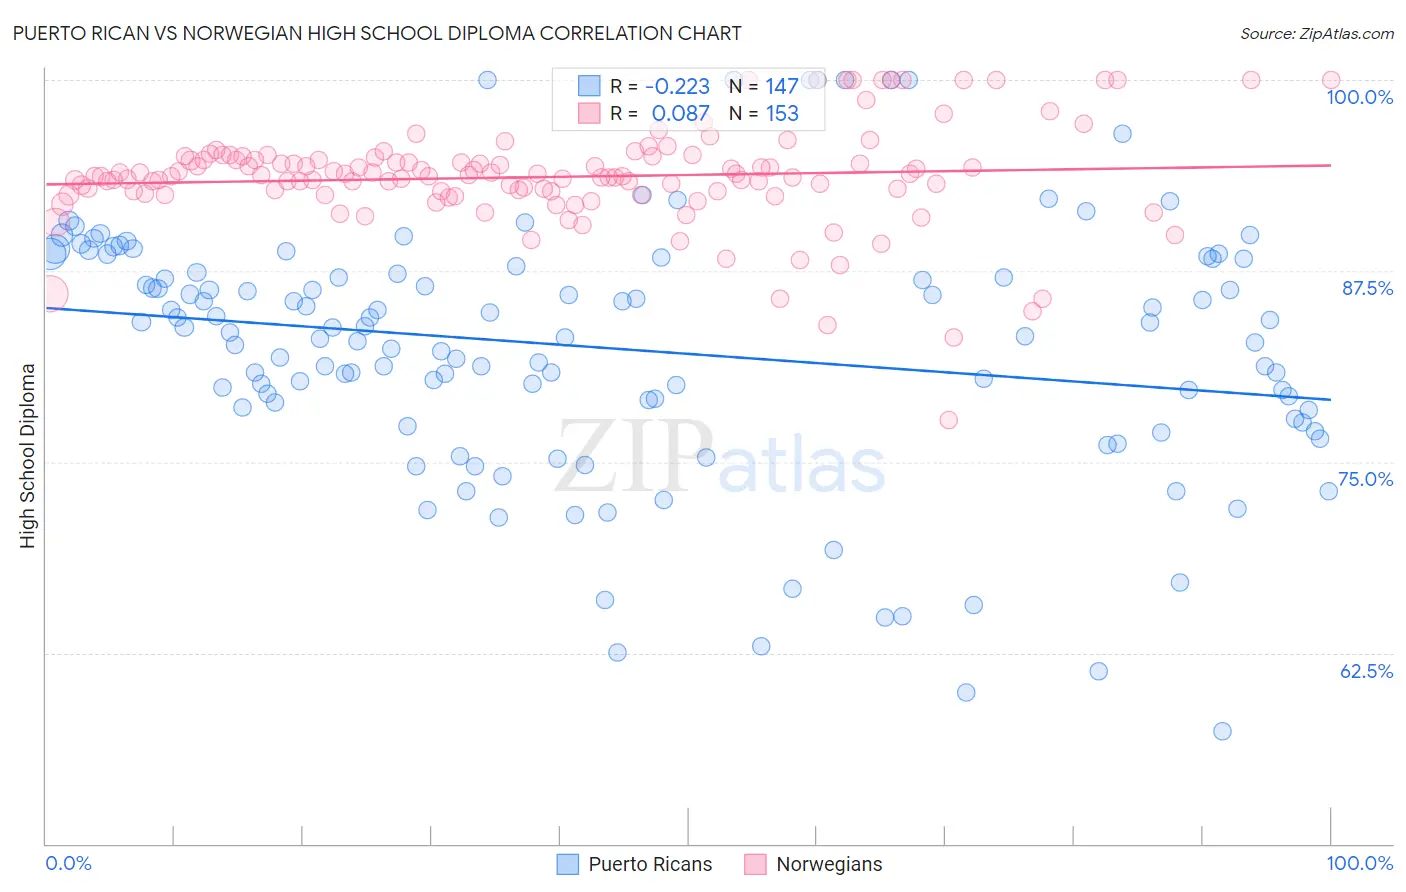
Puerto Rican vs Norwegian High School Diploma Correlation Chart
The statistical analysis conducted on geographies consisting of 528,321,094 people shows a weak negative correlation between the proportion of Puerto Ricans and percentage of population with at least high school diploma education in the United States with a correlation coefficient (R) of -0.223 and weighted average of 84.7%. Similarly, the statistical analysis conducted on geographies consisting of 533,395,571 people shows a slight positive correlation between the proportion of Norwegians and percentage of population with at least high school diploma education in the United States with a correlation coefficient (R) of 0.087 and weighted average of 92.5%, a difference of 9.2%.
High School Diploma Correlation Summary
| Measurement | Puerto Rican | Norwegian |
| Minimum | 57.4% | 77.8% |
| Maximum | 100.0% | 100.0% |
| Range | 42.6% | 22.2% |
| Mean | 82.4% | 93.7% |
| Median | 83.5% | 93.7% |
| Interquartile 25% (IQ1) | 78.4% | 92.7% |
| Interquartile 75% (IQ3) | 87.8% | 94.9% |
| Interquartile Range (IQR) | 9.4% | 2.2% |
| Standard Deviation (Sample) | 8.4% | 3.3% |
| Standard Deviation (Population) | 8.4% | 3.3% |
Similar Demographics by High School Diploma
Demographics Similar to Puerto Ricans by High School Diploma
In terms of high school diploma, the demographic groups most similar to Puerto Ricans are Yaqui (84.7%, a difference of 0.10%), Immigrants from Ecuador (84.8%, a difference of 0.20%), Belizean (84.3%, a difference of 0.40%), Cape Verdean (85.1%, a difference of 0.46%), and Immigrants from Caribbean (84.3%, a difference of 0.46%).
| Demographics | Rating | Rank | High School Diploma |
| Immigrants | Armenia | 0.0 /100 | #308 | Tragic 85.2% |
| Immigrants | Dominica | 0.0 /100 | #309 | Tragic 85.2% |
| Apache | 0.0 /100 | #310 | Tragic 85.1% |
| Ecuadorians | 0.0 /100 | #311 | Tragic 85.1% |
| Cape Verdeans | 0.0 /100 | #312 | Tragic 85.1% |
| Immigrants | Ecuador | 0.0 /100 | #313 | Tragic 84.8% |
| Yaqui | 0.0 /100 | #314 | Tragic 84.7% |
| Puerto Ricans | 0.0 /100 | #315 | Tragic 84.7% |
| Belizeans | 0.0 /100 | #316 | Tragic 84.3% |
| Immigrants | Caribbean | 0.0 /100 | #317 | Tragic 84.3% |
| Immigrants | Belize | 0.0 /100 | #318 | Tragic 84.2% |
| Central American Indians | 0.0 /100 | #319 | Tragic 84.2% |
| Nicaraguans | 0.0 /100 | #320 | Tragic 84.1% |
| Yuman | 0.0 /100 | #321 | Tragic 84.0% |
| Lumbee | 0.0 /100 | #322 | Tragic 83.6% |
Demographics Similar to Norwegians by High School Diploma
In terms of high school diploma, the demographic groups most similar to Norwegians are Swedish (92.2%, a difference of 0.33%), Carpatho Rusyn (92.1%, a difference of 0.43%), Lithuanian (92.0%, a difference of 0.49%), Slovene (92.0%, a difference of 0.49%), and Slovak (92.0%, a difference of 0.51%).
| Demographics | Rating | Rank | High School Diploma |
| Norwegians | 100.0 /100 | #1 | Exceptional 92.5% |
| Swedes | 100.0 /100 | #2 | Exceptional 92.2% |
| Carpatho Rusyns | 100.0 /100 | #3 | Exceptional 92.1% |
| Lithuanians | 100.0 /100 | #4 | Exceptional 92.0% |
| Slovenes | 100.0 /100 | #5 | Exceptional 92.0% |
| Slovaks | 100.0 /100 | #6 | Exceptional 92.0% |
| Immigrants | India | 100.0 /100 | #7 | Exceptional 92.0% |
| Chinese | 100.0 /100 | #8 | Exceptional 92.0% |
| Latvians | 100.0 /100 | #9 | Exceptional 92.0% |
| Croatians | 100.0 /100 | #10 | Exceptional 92.0% |
| Eastern Europeans | 100.0 /100 | #11 | Exceptional 91.9% |
| Poles | 100.0 /100 | #12 | Exceptional 91.9% |
| Danes | 100.0 /100 | #13 | Exceptional 91.8% |
| Bulgarians | 100.0 /100 | #14 | Exceptional 91.8% |
| Luxembourgers | 100.0 /100 | #15 | Exceptional 91.7% |