Puerto Rican vs Immigrants from Sierra Leone Householder Income Under 25 years

COMPARE

Puerto Rican
Race
Ancestry
AfghanAfricanAlaska NativeAlaskan AthabascanAlbanianAleutAlsatianAmericanApacheArabArapahoArgentineanArmenianAssyrian/Chaldean/SyriacAustralianAustrianBahamianBangladeshiBarbadianBasqueBelgianBelizeanBermudanBhutaneseBlackfeetBolivianBrazilianBritishBritish West IndianBulgarianBurmeseCajunCambodianCanadianCape VerdeanCarpatho RusynCelticCentral AmericanCentral American IndianCherokeeCheyenneChickasawChileanChineseChippewaChoctawColombianColvilleComancheCosta RicanCreeCreekCroatianCrowCubanCypriotCzechCzechoslovakianDanishDelawareDominicanDutchDutch West IndianEastern EuropeanEcuadorianEgyptianEnglishEstonianEthiopianEuropeanFijianFilipinoFinnishFrenchFrench American IndianFrench CanadianGermanGerman RussianGhanaianGreekGuamanian/ChamorroGuatemalanGuyaneseHaitianHmongHonduranHopiHoumaHungarianIcelanderIndian (Asian)IndonesianInupiatIranianIraqiIrishIroquoisIsraeliItalianJamaicanJapaneseJordanianKenyanKiowaKoreanLaotianLatvianLebaneseLiberianLithuanianLumbeeLuxembourgerMacedonianMalaysianMalteseMarshalleseMenomineeMexicanMexican American IndianMongolianMoroccanNative HawaiianNavajoNepaleseNew ZealanderNicaraguanNigerianNorthern EuropeanNorwegianOkinawanOsageOttawaPaiutePakistaniPalestinianPanamanianParaguayanPennsylvania GermanPeruvianPimaPolishPortuguesePotawatomiPuebloPuerto RicanPuget Sound SalishRomanianRussianSalvadoranSamoanScandinavianScotch-IrishScottishSeminoleSenegaleseSerbianShoshoneSierra LeoneanSiouxSlavicSlovakSloveneSomaliSouth AfricanSouth AmericanSouth American IndianSoviet UnionSpaniardSpanishSpanish AmericanSpanish American IndianSri LankanSubsaharan AfricanSudaneseSwedishSwissSyrianTaiwaneseThaiTlingit-HaidaTohono O'OdhamTonganTrinidadian and TobagonianTsimshianTurkishU.S. Virgin IslanderUgandanUkrainianUruguayanUteVenezuelanVietnameseWelshWest IndianYakamaYaquiYugoslavianYumanYup'ikZimbabwean
Immigration
NonimmigrantsImmigrantsAfghanistanAfricaAlbaniaArgentinaArmeniaAsiaAustraliaAustriaBahamasBangladeshBarbadosBelarusBelgiumBelizeBoliviaBosnia and HerzegovinaBrazilBulgariaBurma/MyanmarCabo VerdeCambodiaCameroonCanadaCaribbeanCentral AmericaChileChinaColombiaCongoCosta RicaCroatiaCubaCzechoslovakiaDenmarkDominicaDominican RepublicEastern AfricaEastern AsiaEastern EuropeEcuadorEgyptEl SalvadorEnglandEritreaEthiopiaEuropeFijiFranceGermanyGhanaGreeceGrenadaGuatemalaGuyanaHaitiHondurasHong KongHungaryIndiaIndonesiaIranIraqIrelandIsraelItalyJamaicaJapanJordanKazakhstanKenyaKoreaKuwaitLaosLatin AmericaLatviaLebanonLiberiaLithuaniaMalaysiaMexicoMicronesiaMiddle AfricaMoldovaMoroccoNepalNetherlandsNicaraguaNigeriaNorth AmericaNorth MacedoniaNorthern AfricaNorthern EuropeNorwayOceaniaPakistanPanamaPeruPhilippinesPolandPortugalRomaniaRussiaSaudi ArabiaScotlandSenegalSerbiaSingaporeSomaliaSouth AfricaSouth AmericaSouth Central AsiaSouth Eastern AsiaSouthern EuropeSpainSri LankaSt. Vincent and the GrenadinesSudanSwedenSwitzerlandSyriaTaiwanThailandTrinidad and TobagoTurkeyUgandaUkraineUruguayUzbekistanVenezuelaVietnamWest IndiesWestern AfricaWestern AsiaWestern EuropeYemenZaireZimbabweAzores
Immigrants from Sierra Leone
Race
Ancestry
AfghanAfricanAlaska NativeAlaskan AthabascanAlbanianAleutAlsatianAmericanApacheArabArapahoArgentineanArmenianAssyrian/Chaldean/SyriacAustralianAustrianBahamianBangladeshiBarbadianBasqueBelgianBelizeanBermudanBhutaneseBlackfeetBolivianBrazilianBritishBritish West IndianBulgarianBurmeseCajunCambodianCanadianCape VerdeanCarpatho RusynCelticCentral AmericanCentral American IndianCherokeeCheyenneChickasawChileanChineseChippewaChoctawColombianColvilleComancheCosta RicanCreeCreekCroatianCrowCubanCypriotCzechCzechoslovakianDanishDelawareDominicanDutchDutch West IndianEastern EuropeanEcuadorianEgyptianEnglishEstonianEthiopianEuropeanFijianFilipinoFinnishFrenchFrench American IndianFrench CanadianGermanGerman RussianGhanaianGreekGuamanian/ChamorroGuatemalanGuyaneseHaitianHmongHonduranHopiHoumaHungarianIcelanderIndian (Asian)IndonesianInupiatIranianIraqiIrishIroquoisIsraeliItalianJamaicanJapaneseJordanianKenyanKiowaKoreanLaotianLatvianLebaneseLiberianLithuanianLumbeeLuxembourgerMacedonianMalaysianMalteseMarshalleseMenomineeMexicanMexican American IndianMongolianMoroccanNative HawaiianNavajoNepaleseNew ZealanderNicaraguanNigerianNorthern EuropeanNorwegianOkinawanOsageOttawaPaiutePakistaniPalestinianPanamanianParaguayanPennsylvania GermanPeruvianPimaPolishPortuguesePotawatomiPuebloPuget Sound SalishRomanianRussianSalvadoranSamoanScandinavianScotch-IrishScottishSeminoleSenegaleseSerbianShoshoneSierra LeoneanSiouxSlavicSlovakSloveneSomaliSouth AfricanSouth AmericanSouth American IndianSoviet UnionSpaniardSpanishSpanish AmericanSpanish American IndianSri LankanSubsaharan AfricanSudaneseSwedishSwissSyrianTaiwaneseThaiTlingit-HaidaTohono O'OdhamTonganTrinidadian and TobagonianTsimshianTurkishU.S. Virgin IslanderUgandanUkrainianUruguayanUteVenezuelanVietnameseWelshWest IndianYakamaYaquiYugoslavianYumanYup'ikZimbabwean
Immigration
NonimmigrantsImmigrantsAfghanistanAfricaAlbaniaArgentinaArmeniaAsiaAustraliaAustriaBahamasBangladeshBarbadosBelarusBelgiumBelizeBoliviaBosnia and HerzegovinaBrazilBulgariaBurma/MyanmarCabo VerdeCambodiaCameroonCanadaCaribbeanCentral AmericaChileChinaColombiaCongoCosta RicaCroatiaCubaCzechoslovakiaDenmarkDominicaDominican RepublicEastern AfricaEastern AsiaEastern EuropeEcuadorEgyptEl SalvadorEnglandEritreaEthiopiaEuropeFijiFranceGermanyGhanaGreeceGrenadaGuatemalaGuyanaHaitiHondurasHong KongHungaryIndiaIndonesiaIranIraqIrelandIsraelItalyJamaicaJapanJordanKazakhstanKenyaKoreaKuwaitLaosLatin AmericaLatviaLebanonLiberiaLithuaniaMalaysiaMexicoMicronesiaMiddle AfricaMoldovaMoroccoNepalNetherlandsNicaraguaNigeriaNorth AmericaNorth MacedoniaNorthern AfricaNorthern EuropeNorwayOceaniaPakistanPanamaPeruPhilippinesPolandPortugalRomaniaRussiaSaudi ArabiaScotlandSenegalSerbiaSierra LeoneSingaporeSomaliaSouth AfricaSouth AmericaSouth Central AsiaSouth Eastern AsiaSouthern EuropeSpainSri LankaSt. Vincent and the GrenadinesSudanSwedenSwitzerlandSyriaTaiwanThailandTrinidad and TobagoTurkeyUgandaUkraineUruguayUzbekistanVenezuelaVietnamWest IndiesWestern AfricaWestern AsiaWestern EuropeYemenZaireZimbabweAzores
Householder Income Under 25 years
Income
Poverty
Unemployment
Labor Participation
Family Structure
Vehicle Availability
Education Level
Disability

Householder Income Under 25 years Comparison

Puerto Ricans

Immigrants from Sierra Leone

Tragic
Exceptional
$39,726
HOUSEHOLDER INCOME UNDER 25 YEARS
0.0/ 100
METRIC RATING
346th/ 347
METRIC RANK
$54,190
HOUSEHOLDER INCOME UNDER 25 YEARS
99.3/ 100
METRIC RATING
94th/ 347
METRIC RANK

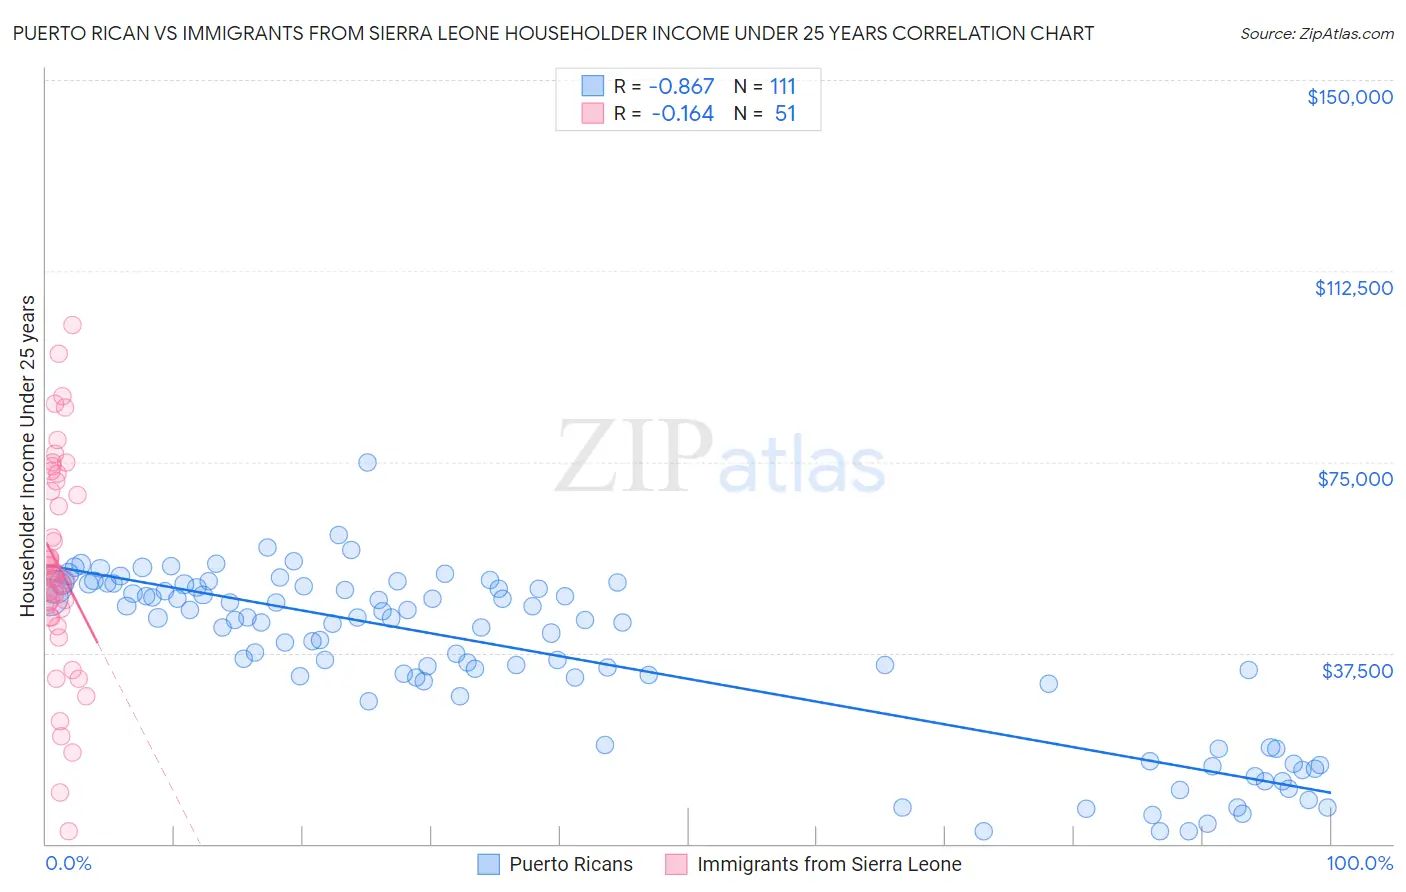
Puerto Rican vs Immigrants from Sierra Leone Householder Income Under 25 years Correlation Chart

The statistical analysis conducted on geographies consisting of 421,445,593 people shows a very strong negative correlation between the proportion of Puerto Ricans and household income with householder under the age of 25 in the United States with a correlation coefficient (R) of -0.867 and weighted average of $39,726. Similarly, the statistical analysis conducted on geographies consisting of 94,629,057 people shows a poor negative correlation between the proportion of Immigrants from Sierra Leone and household income with householder under the age of 25 in the United States with a correlation coefficient (R) of -0.164 and weighted average of $54,190, a difference of 36.4%.
Puerto Rican vs Immigrants from Sierra Leone Householder Income Under 25 years

Householder Income Under 25 years Correlation Summary

MeasurementPuerto RicanImmigrants from Sierra Leone
Minimum$2,499$2,499
Maximum$74,844$101,774
Range$72,345$99,275
Mean$37,468$54,632
Median$43,546$53,088
Interquartile 25% (IQ1)$28,872$44,586
Interquartile 75% (IQ3)$50,281$71,123
Interquartile Range (IQR)$21,410$26,537
Standard Deviation (Sample)$16,633$20,949
Standard Deviation (Population)$16,558$20,742

Similar Demographics by Householder Income Under 25 years

Demographics Similar to Puerto Ricans by Householder Income Under 25 years

In terms of householder income under 25 years, the demographic groups most similar to Puerto Ricans are Navajo ($42,380, a difference of 6.7%), Immigrants from Congo ($43,266, a difference of 8.9%), Immigrants from Yemen ($43,591, a difference of 9.7%), Arapaho ($44,003, a difference of 10.8%), and Houma ($44,356, a difference of 11.7%).
DemographicsRating | RankHouseholder Income Under 25 years
Creek
0.0
/100
|
#333
Tragic
$45,371
Cajuns
0.0
/100
|
#334
Tragic
$45,338
Cheyenne
0.0
/100
|
#335
Tragic
$45,275
Tohono O'odham
0.0
/100
|
#336
Tragic
$45,248
Pueblo
0.0
/100
|
#337
Tragic
$45,018
Chickasaw
0.0
/100
|
#338
Tragic
$44,763
Kiowa
0.0
/100
|
#339
Tragic
$44,733
Blacks/African Americans
0.0
/100
|
#340
Tragic
$44,381
Houma
0.0
/100
|
#341
Tragic
$44,356
Arapaho
0.0
/100
|
#342
Tragic
$44,003
Immigrants | Yemen
0.0
/100
|
#343
Tragic
$43,591
Immigrants | Congo
0.0
/100
|
#344
Tragic
$43,266
Navajo
0.0
/100
|
#345
Tragic
$42,380
Puerto Ricans
0.0
/100
|
#346
Tragic
$39,726
Lumbee
0.0
/100
|
#347
Tragic
$34,584

Demographics Similar to Immigrants from Sierra Leone by Householder Income Under 25 years

In terms of householder income under 25 years, the demographic groups most similar to Immigrants from Sierra Leone are Immigrants from Malaysia ($54,179, a difference of 0.020%), Immigrants from Argentina ($54,209, a difference of 0.030%), Immigrants from St. Vincent and the Grenadines ($54,230, a difference of 0.070%), Argentinean ($54,154, a difference of 0.070%), and Immigrants from Egypt ($54,239, a difference of 0.090%).
DemographicsRating | RankHouseholder Income Under 25 years
Brazilians
99.5
/100
|
#87
Exceptional
$54,335
Yakama
99.5
/100
|
#88
Exceptional
$54,321
Immigrants | South America
99.4
/100
|
#89
Exceptional
$54,268
Turks
99.4
/100
|
#90
Exceptional
$54,266
Immigrants | Egypt
99.3
/100
|
#91
Exceptional
$54,239
Immigrants | St. Vincent and the Grenadines
99.3
/100
|
#92
Exceptional
$54,230
Immigrants | Argentina
99.3
/100
|
#93
Exceptional
$54,209
Immigrants | Sierra Leone
99.3
/100
|
#94
Exceptional
$54,190
Immigrants | Malaysia
99.2
/100
|
#95
Exceptional
$54,179
Argentineans
99.2
/100
|
#96
Exceptional
$54,154
Immigrants | Portugal
99.1
/100
|
#97
Exceptional
$54,105
Eastern Europeans
99.0
/100
|
#98
Exceptional
$54,066
Alaska Natives
98.8
/100
|
#99
Exceptional
$54,000
Immigrants | Kazakhstan
98.8
/100
|
#100
Exceptional
$53,990
South Americans
98.6
/100
|
#101
Exceptional
$53,939