Immigrants from Cabo Verde vs Immigrants from Panama 11th Grade

COMPARE

Immigrants from Cabo Verde
Race
Ancestry
AfghanAfricanAlaska NativeAlaskan AthabascanAlbanianAleutAlsatianAmericanApacheArabArapahoArgentineanArmenianAssyrian/Chaldean/SyriacAustralianAustrianBahamianBangladeshiBarbadianBasqueBelgianBelizeanBermudanBhutaneseBlackfeetBolivianBrazilianBritishBritish West IndianBulgarianBurmeseCajunCambodianCanadianCape VerdeanCarpatho RusynCelticCentral AmericanCentral American IndianCherokeeCheyenneChickasawChileanChineseChippewaChoctawColombianColvilleComancheCosta RicanCreeCreekCroatianCrowCubanCypriotCzechCzechoslovakianDanishDelawareDominicanDutchDutch West IndianEastern EuropeanEcuadorianEgyptianEnglishEstonianEthiopianEuropeanFijianFilipinoFinnishFrenchFrench American IndianFrench CanadianGermanGerman RussianGhanaianGreekGuamanian/ChamorroGuatemalanGuyaneseHaitianHmongHonduranHopiHoumaHungarianIcelanderIndian (Asian)IndonesianInupiatIranianIraqiIrishIroquoisIsraeliItalianJamaicanJapaneseJordanianKenyanKiowaKoreanLaotianLatvianLebaneseLiberianLithuanianLumbeeLuxembourgerMacedonianMalaysianMalteseMarshalleseMenomineeMexicanMexican American IndianMongolianMoroccanNative HawaiianNavajoNepaleseNew ZealanderNicaraguanNigerianNorthern EuropeanNorwegianOkinawanOsageOttawaPaiutePakistaniPalestinianPanamanianParaguayanPennsylvania GermanPeruvianPimaPolishPortuguesePotawatomiPuebloPuerto RicanPuget Sound SalishRomanianRussianSalvadoranSamoanScandinavianScotch-IrishScottishSeminoleSenegaleseSerbianShoshoneSierra LeoneanSiouxSlavicSlovakSloveneSomaliSouth AfricanSouth AmericanSouth American IndianSoviet UnionSpaniardSpanishSpanish AmericanSpanish American IndianSri LankanSubsaharan AfricanSudaneseSwedishSwissSyrianTaiwaneseThaiTlingit-HaidaTohono O'OdhamTonganTrinidadian and TobagonianTsimshianTurkishU.S. Virgin IslanderUgandanUkrainianUruguayanUteVenezuelanVietnameseWelshWest IndianYakamaYaquiYugoslavianYumanYup'ikZimbabwean
Immigration
NonimmigrantsImmigrantsAfghanistanAfricaAlbaniaArgentinaArmeniaAsiaAustraliaAustriaBahamasBangladeshBarbadosBelarusBelgiumBelizeBoliviaBosnia and HerzegovinaBrazilBulgariaBurma/MyanmarCabo VerdeCambodiaCameroonCanadaCaribbeanCentral AmericaChileChinaColombiaCongoCosta RicaCroatiaCubaCzechoslovakiaDenmarkDominicaDominican RepublicEastern AfricaEastern AsiaEastern EuropeEcuadorEgyptEl SalvadorEnglandEritreaEthiopiaEuropeFijiFranceGermanyGhanaGreeceGrenadaGuatemalaGuyanaHaitiHondurasHong KongHungaryIndiaIndonesiaIranIraqIrelandIsraelItalyJamaicaJapanJordanKazakhstanKenyaKoreaKuwaitLaosLatin AmericaLatviaLebanonLiberiaLithuaniaMalaysiaMexicoMicronesiaMiddle AfricaMoldovaMoroccoNepalNetherlandsNicaraguaNigeriaNorth AmericaNorth MacedoniaNorthern AfricaNorthern EuropeNorwayOceaniaPakistanPeruPhilippinesPolandPortugalRomaniaRussiaSaudi ArabiaScotlandSenegalSerbiaSierra LeoneSingaporeSomaliaSouth AfricaSouth AmericaSouth Central AsiaSouth Eastern AsiaSouthern EuropeSpainSri LankaSt. Vincent and the GrenadinesSudanSwedenSwitzerlandSyriaTaiwanThailandTrinidad and TobagoTurkeyUgandaUkraineUruguayUzbekistanVenezuelaVietnamWest IndiesWestern AfricaWestern AsiaWestern EuropeYemenZaireZimbabweAzores
Immigrants from Panama
Race
Ancestry
AfghanAfricanAlaska NativeAlaskan AthabascanAlbanianAleutAlsatianAmericanApacheArabArapahoArgentineanArmenianAssyrian/Chaldean/SyriacAustralianAustrianBahamianBangladeshiBarbadianBasqueBelgianBelizeanBermudanBhutaneseBlackfeetBolivianBrazilianBritishBritish West IndianBulgarianBurmeseCajunCambodianCanadianCape VerdeanCarpatho RusynCelticCentral AmericanCentral American IndianCherokeeCheyenneChickasawChileanChineseChippewaChoctawColombianColvilleComancheCosta RicanCreeCreekCroatianCrowCubanCypriotCzechCzechoslovakianDanishDelawareDominicanDutchDutch West IndianEastern EuropeanEcuadorianEgyptianEnglishEstonianEthiopianEuropeanFijianFilipinoFinnishFrenchFrench American IndianFrench CanadianGermanGerman RussianGhanaianGreekGuamanian/ChamorroGuatemalanGuyaneseHaitianHmongHonduranHopiHoumaHungarianIcelanderIndian (Asian)IndonesianInupiatIranianIraqiIrishIroquoisIsraeliItalianJamaicanJapaneseJordanianKenyanKiowaKoreanLaotianLatvianLebaneseLiberianLithuanianLumbeeLuxembourgerMacedonianMalaysianMalteseMarshalleseMenomineeMexicanMexican American IndianMongolianMoroccanNative HawaiianNavajoNepaleseNew ZealanderNicaraguanNigerianNorthern EuropeanNorwegianOkinawanOsageOttawaPaiutePakistaniPalestinianPanamanianParaguayanPennsylvania GermanPeruvianPimaPolishPortuguesePotawatomiPuebloPuerto RicanPuget Sound SalishRomanianRussianSalvadoranSamoanScandinavianScotch-IrishScottishSeminoleSenegaleseSerbianShoshoneSierra LeoneanSiouxSlavicSlovakSloveneSomaliSouth AfricanSouth AmericanSouth American IndianSoviet UnionSpaniardSpanishSpanish AmericanSpanish American IndianSri LankanSubsaharan AfricanSudaneseSwedishSwissSyrianTaiwaneseThaiTlingit-HaidaTohono O'OdhamTonganTrinidadian and TobagonianTsimshianTurkishU.S. Virgin IslanderUgandanUkrainianUruguayanUteVenezuelanVietnameseWelshWest IndianYakamaYaquiYugoslavianYumanYup'ikZimbabwean
Immigration
NonimmigrantsImmigrantsAfghanistanAfricaAlbaniaArgentinaArmeniaAsiaAustraliaAustriaBahamasBangladeshBarbadosBelarusBelgiumBelizeBoliviaBosnia and HerzegovinaBrazilBulgariaBurma/MyanmarCambodiaCameroonCanadaCaribbeanCentral AmericaChileChinaColombiaCongoCosta RicaCroatiaCubaCzechoslovakiaDenmarkDominicaDominican RepublicEastern AfricaEastern AsiaEastern EuropeEcuadorEgyptEl SalvadorEnglandEritreaEthiopiaEuropeFijiFranceGermanyGhanaGreeceGrenadaGuatemalaGuyanaHaitiHondurasHong KongHungaryIndiaIndonesiaIranIraqIrelandIsraelItalyJamaicaJapanJordanKazakhstanKenyaKoreaKuwaitLaosLatin AmericaLatviaLebanonLiberiaLithuaniaMalaysiaMexicoMicronesiaMiddle AfricaMoldovaMoroccoNepalNetherlandsNicaraguaNigeriaNorth AmericaNorth MacedoniaNorthern AfricaNorthern EuropeNorwayOceaniaPakistanPanamaPeruPhilippinesPolandPortugalRomaniaRussiaSaudi ArabiaScotlandSenegalSerbiaSierra LeoneSingaporeSomaliaSouth AfricaSouth AmericaSouth Central AsiaSouth Eastern AsiaSouthern EuropeSpainSri LankaSt. Vincent and the GrenadinesSudanSwedenSwitzerlandSyriaTaiwanThailandTrinidad and TobagoTurkeyUgandaUkraineUruguayUzbekistanVenezuelaVietnamWest IndiesWestern AfricaWestern AsiaWestern EuropeYemenZaireZimbabweAzores
11th Grade
Income
Poverty
Unemployment
Labor Participation
Family Structure
Vehicle Availability
Education Level
Disability

11th Grade Comparison

Immigrants from Cabo Verde

Immigrants from Panama

Tragic
Tragic
87.6%
11TH GRADE
0.0/ 100
METRIC RATING
327th/ 347
METRIC RANK
91.8%
11TH GRADE
4.3/ 100
METRIC RATING
228th/ 347
METRIC RANK

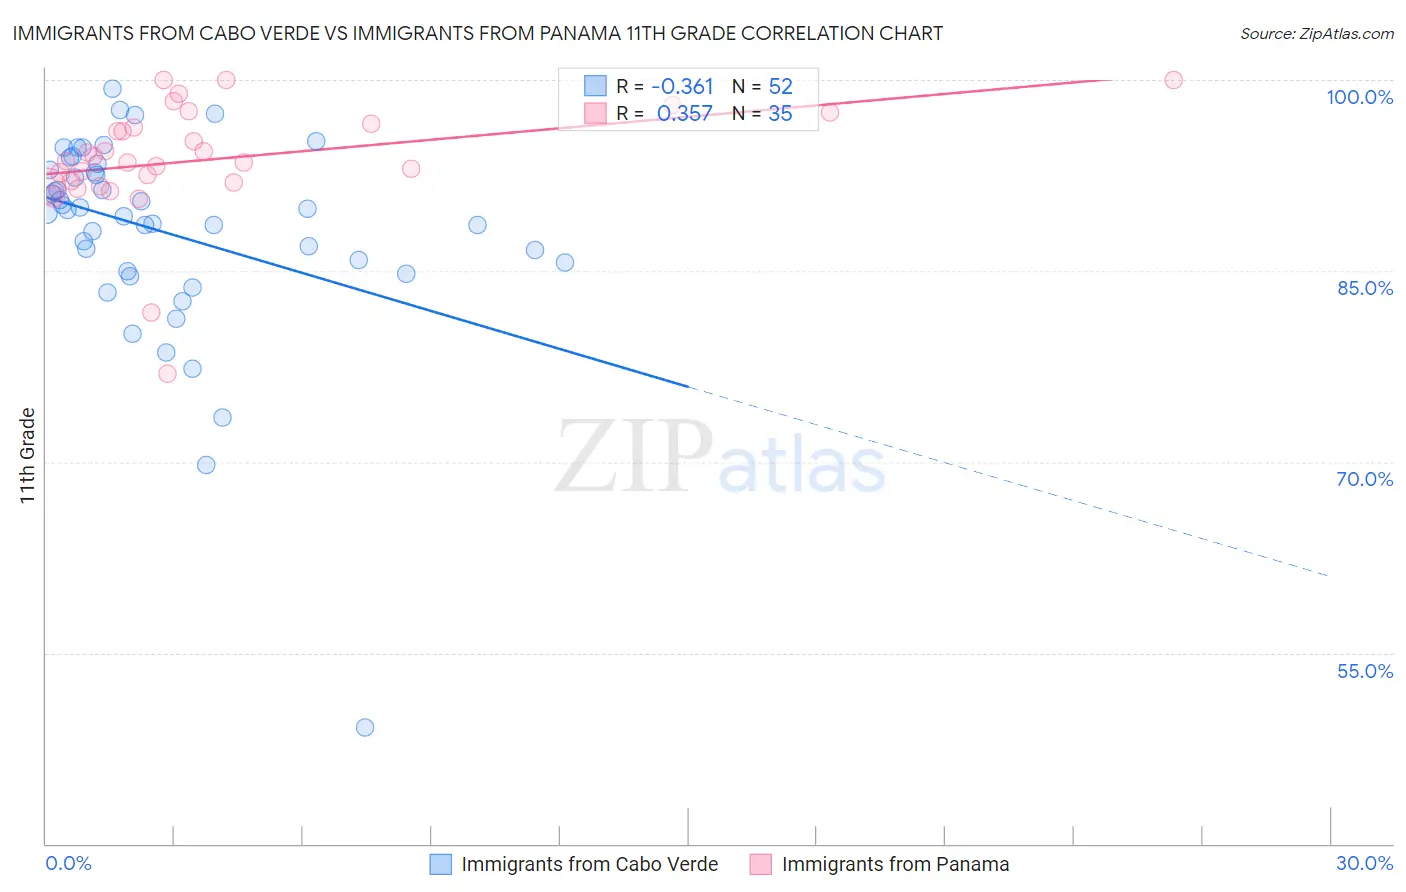
Immigrants from Cabo Verde vs Immigrants from Panama 11th Grade Correlation Chart

The statistical analysis conducted on geographies consisting of 38,158,504 people shows a mild negative correlation between the proportion of Immigrants from Cabo Verde and percentage of population with at least 11th grade education in the United States with a correlation coefficient (R) of -0.361 and weighted average of 87.6%. Similarly, the statistical analysis conducted on geographies consisting of 221,183,192 people shows a mild positive correlation between the proportion of Immigrants from Panama and percentage of population with at least 11th grade education in the United States with a correlation coefficient (R) of 0.357 and weighted average of 91.8%, a difference of 4.8%.
Immigrants from Cabo Verde vs Immigrants from Panama 11th Grade

11th Grade Correlation Summary

MeasurementImmigrants from Cabo VerdeImmigrants from Panama
Minimum49.2%76.9%
Maximum99.3%100.0%
Range50.1%23.1%
Mean88.0%93.8%
Median89.7%93.6%
Interquartile 25% (IQ1)85.3%91.9%
Interquartile 75% (IQ3)92.8%96.5%
Interquartile Range (IQR)7.5%4.6%
Standard Deviation (Sample)8.1%4.6%
Standard Deviation (Population)8.0%4.5%

Similar Demographics by 11th Grade

Demographics Similar to Immigrants from Cabo Verde by 11th Grade

In terms of 11th grade, the demographic groups most similar to Immigrants from Cabo Verde are Dominican (87.7%, a difference of 0.020%), Tohono O'odham (87.6%, a difference of 0.060%), Mexican American Indian (87.5%, a difference of 0.13%), Honduran (87.4%, a difference of 0.31%), and Hispanic or Latino (87.3%, a difference of 0.38%).
DemographicsRating | Rank11th Grade
Immigrants | Armenia
0.0
/100
|
#320
Tragic
88.8%
Immigrants | Belize
0.0
/100
|
#321
Tragic
88.7%
Puerto Ricans
0.0
/100
|
#322
Tragic
88.4%
Pima
0.0
/100
|
#323
Tragic
88.3%
Central American Indians
0.0
/100
|
#324
Tragic
88.2%
Immigrants | Nicaragua
0.0
/100
|
#325
Tragic
88.1%
Dominicans
0.0
/100
|
#326
Tragic
87.7%
Immigrants | Cabo Verde
0.0
/100
|
#327
Tragic
87.6%
Tohono O'odham
0.0
/100
|
#328
Tragic
87.6%
Mexican American Indians
0.0
/100
|
#329
Tragic
87.5%
Hondurans
0.0
/100
|
#330
Tragic
87.4%
Hispanics or Latinos
0.0
/100
|
#331
Tragic
87.3%
Immigrants | Azores
0.0
/100
|
#332
Tragic
87.2%
Immigrants | Yemen
0.0
/100
|
#333
Tragic
87.1%
Houma
0.0
/100
|
#334
Tragic
87.0%

Demographics Similar to Immigrants from Panama by 11th Grade

In terms of 11th grade, the demographic groups most similar to Immigrants from Panama are Immigrants from Cameroon (91.8%, a difference of 0.0%), Nigerian (91.8%, a difference of 0.0%), Immigrants from Afghanistan (91.8%, a difference of 0.030%), Choctaw (91.8%, a difference of 0.040%), and Immigrants from Somalia (91.9%, a difference of 0.050%).
DemographicsRating | Rank11th Grade
Immigrants | Liberia
7.0
/100
|
#221
Tragic
91.9%
Immigrants | Africa
6.5
/100
|
#222
Tragic
91.9%
Immigrants | Bahamas
6.5
/100
|
#223
Tragic
91.9%
Costa Ricans
6.3
/100
|
#224
Tragic
91.9%
Immigrants | Zaire
5.4
/100
|
#225
Tragic
91.9%
Immigrants | Somalia
5.2
/100
|
#226
Tragic
91.9%
Immigrants | Cameroon
4.4
/100
|
#227
Tragic
91.8%
Immigrants | Panama
4.3
/100
|
#228
Tragic
91.8%
Nigerians
4.3
/100
|
#229
Tragic
91.8%
Immigrants | Afghanistan
3.9
/100
|
#230
Tragic
91.8%
Choctaw
3.7
/100
|
#231
Tragic
91.8%
Uruguayans
3.5
/100
|
#232
Tragic
91.8%
Cheyenne
3.3
/100
|
#233
Tragic
91.8%
Armenians
2.9
/100
|
#234
Tragic
91.7%
Sub-Saharan Africans
2.9
/100
|
#235
Tragic
91.7%