Puerto Rican vs Immigrants from Panama Unemployment Among Seniors over 65 years
COMPARE
Puerto Rican
Immigrants from Panama
Unemployment Among Seniors over 65 years
Unemployment Among Seniors over 65 years Comparison
Puerto Ricans
Immigrants from Panama
5.9%
UNEMPLOYMENT AMONG SENIORS OVER 65 YEARS
0.0/ 100
METRIC RATING
328th/ 347
METRIC RANK
5.1%
UNEMPLOYMENT AMONG SENIORS OVER 65 YEARS
83.0/ 100
METRIC RATING
139th/ 347
METRIC RANK
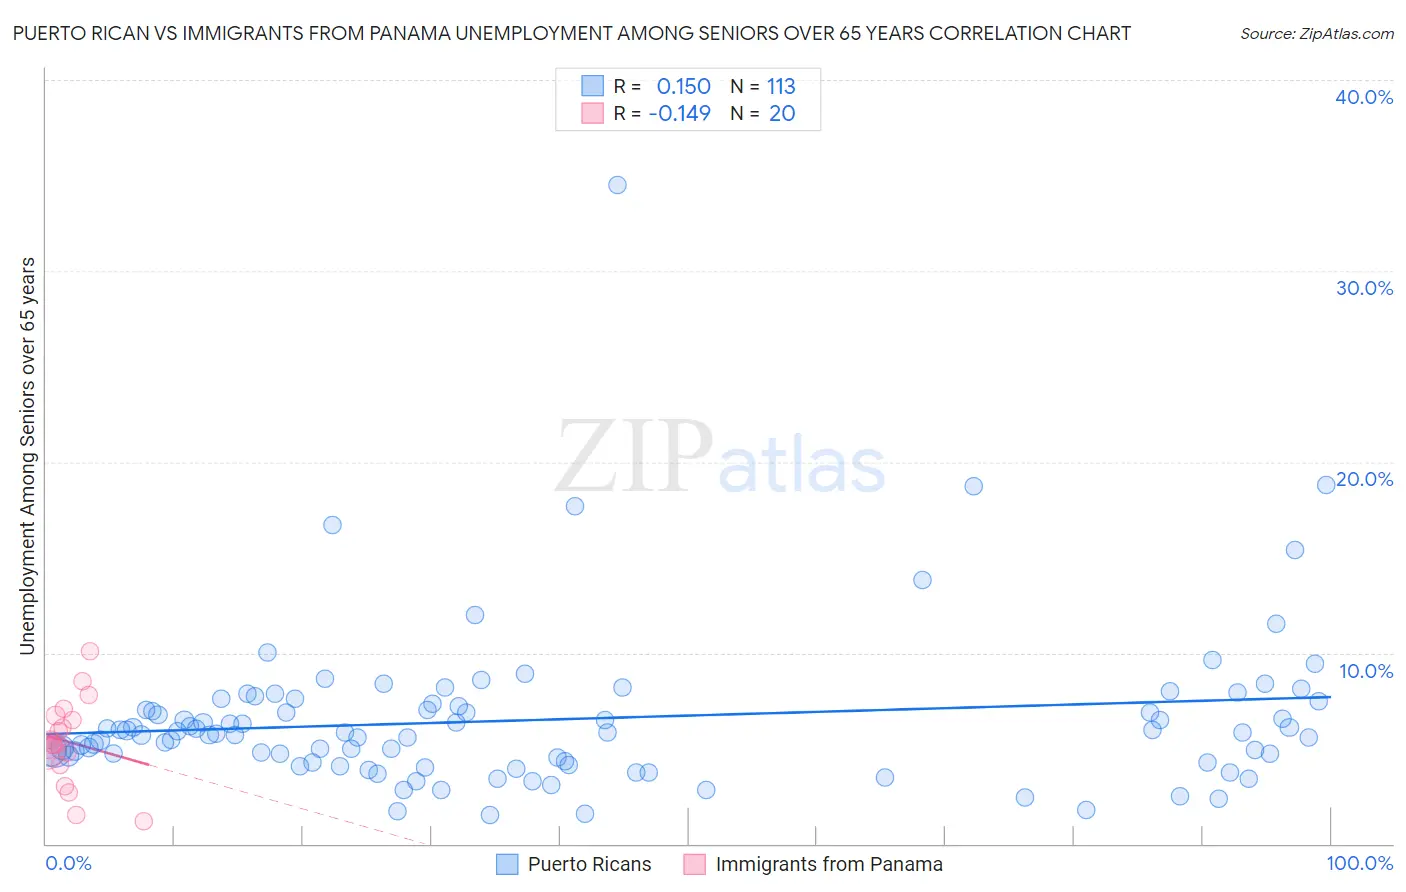
Puerto Rican vs Immigrants from Panama Unemployment Among Seniors over 65 years Correlation Chart
The statistical analysis conducted on geographies consisting of 446,288,671 people shows a poor positive correlation between the proportion of Puerto Ricans and unemployment rate amomg seniors over the age of 65 in the United States with a correlation coefficient (R) of 0.150 and weighted average of 5.9%. Similarly, the statistical analysis conducted on geographies consisting of 209,001,449 people shows a poor negative correlation between the proportion of Immigrants from Panama and unemployment rate amomg seniors over the age of 65 in the United States with a correlation coefficient (R) of -0.149 and weighted average of 5.1%, a difference of 16.5%.
Unemployment Among Seniors over 65 years Correlation Summary
| Measurement | Puerto Rican | Immigrants from Panama |
| Minimum | 1.5% | 1.2% |
| Maximum | 34.5% | 10.1% |
| Range | 33.0% | 8.9% |
| Mean | 6.5% | 5.3% |
| Median | 5.8% | 5.2% |
| Interquartile 25% (IQ1) | 4.3% | 4.5% |
| Interquartile 75% (IQ3) | 7.4% | 6.6% |
| Interquartile Range (IQR) | 3.1% | 2.2% |
| Standard Deviation (Sample) | 4.2% | 2.2% |
| Standard Deviation (Population) | 4.2% | 2.2% |
Similar Demographics by Unemployment Among Seniors over 65 years
Demographics Similar to Puerto Ricans by Unemployment Among Seniors over 65 years
In terms of unemployment among seniors over 65 years, the demographic groups most similar to Puerto Ricans are Bermudan (5.9%, a difference of 0.53%), Dominican (6.0%, a difference of 0.75%), Immigrants from Portugal (6.0%, a difference of 0.77%), Taiwanese (6.0%, a difference of 0.92%), and Aleut (6.0%, a difference of 0.97%).
| Demographics | Rating | Rank | Unemployment Among Seniors over 65 years |
| British West Indians | 0.0 /100 | #321 | Tragic 5.8% |
| Natives/Alaskans | 0.0 /100 | #322 | Tragic 5.8% |
| Immigrants | Dominica | 0.0 /100 | #323 | Tragic 5.8% |
| Yuman | 0.0 /100 | #324 | Tragic 5.8% |
| Inupiat | 0.0 /100 | #325 | Tragic 5.8% |
| Shoshone | 0.0 /100 | #326 | Tragic 5.9% |
| Bermudans | 0.0 /100 | #327 | Tragic 5.9% |
| Puerto Ricans | 0.0 /100 | #328 | Tragic 5.9% |
| Dominicans | 0.0 /100 | #329 | Tragic 6.0% |
| Immigrants | Portugal | 0.0 /100 | #330 | Tragic 6.0% |
| Taiwanese | 0.0 /100 | #331 | Tragic 6.0% |
| Aleuts | 0.0 /100 | #332 | Tragic 6.0% |
| Immigrants | Dominican Republic | 0.0 /100 | #333 | Tragic 6.0% |
| Tohono O'odham | 0.0 /100 | #334 | Tragic 6.1% |
| Immigrants | Armenia | 0.0 /100 | #335 | Tragic 6.2% |
Demographics Similar to Immigrants from Panama by Unemployment Among Seniors over 65 years
In terms of unemployment among seniors over 65 years, the demographic groups most similar to Immigrants from Panama are Immigrants from Chile (5.1%, a difference of 0.0%), New Zealander (5.1%, a difference of 0.010%), Ukrainian (5.1%, a difference of 0.080%), White/Caucasian (5.1%, a difference of 0.080%), and Arab (5.1%, a difference of 0.080%).
| Demographics | Rating | Rank | Unemployment Among Seniors over 65 years |
| Chileans | 85.6 /100 | #132 | Excellent 5.1% |
| Syrians | 85.3 /100 | #133 | Excellent 5.1% |
| Turks | 84.9 /100 | #134 | Excellent 5.1% |
| Ukrainians | 84.4 /100 | #135 | Excellent 5.1% |
| Whites/Caucasians | 84.4 /100 | #136 | Excellent 5.1% |
| Arabs | 84.3 /100 | #137 | Excellent 5.1% |
| New Zealanders | 83.2 /100 | #138 | Excellent 5.1% |
| Immigrants | Panama | 83.0 /100 | #139 | Excellent 5.1% |
| Immigrants | Chile | 83.0 /100 | #140 | Excellent 5.1% |
| Cherokee | 81.6 /100 | #141 | Excellent 5.1% |
| Immigrants | Indonesia | 81.0 /100 | #142 | Excellent 5.1% |
| Senegalese | 80.4 /100 | #143 | Excellent 5.1% |
| Poles | 80.3 /100 | #144 | Excellent 5.1% |
| Spanish | 78.8 /100 | #145 | Good 5.1% |
| Immigrants | Russia | 78.5 /100 | #146 | Good 5.1% |