Immigrants from Cabo Verde vs Immigrants from Korea No Schooling Completed
COMPARE
Immigrants from Cabo Verde
Immigrants from Korea
No Schooling Completed
No Schooling Completed Comparison
Immigrants from Cabo Verde
Immigrants from Korea
3.5%
NO SCHOOLING COMPLETED
0.0/ 100
METRIC RATING
337th/ 347
METRIC RANK
2.0%
NO SCHOOLING COMPLETED
66.7/ 100
METRIC RATING
158th/ 347
METRIC RANK
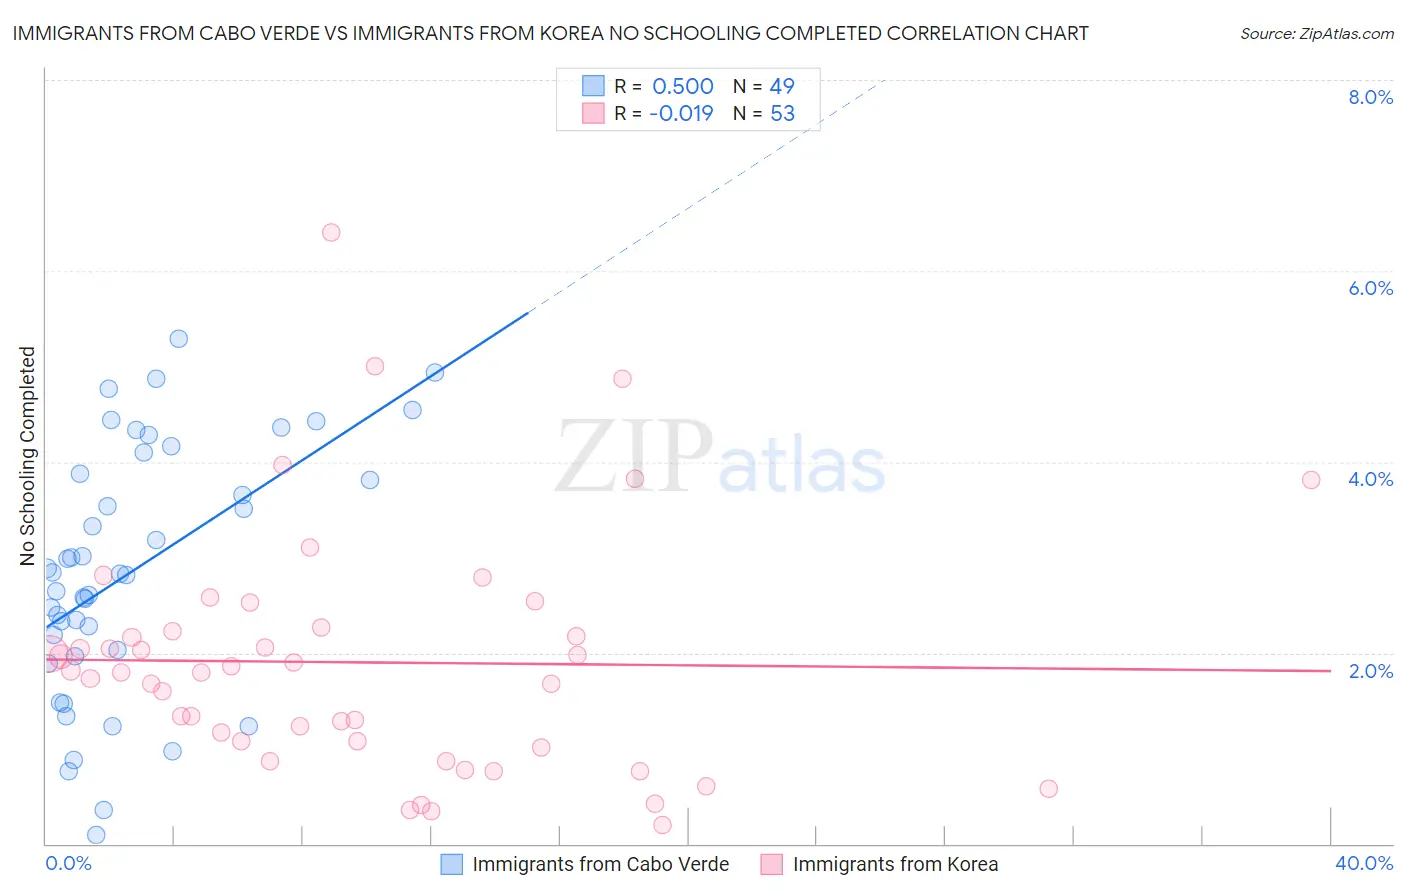
Immigrants from Cabo Verde vs Immigrants from Korea No Schooling Completed Correlation Chart
The statistical analysis conducted on geographies consisting of 38,057,736 people shows a substantial positive correlation between the proportion of Immigrants from Cabo Verde and percentage of population with no schooling in the United States with a correlation coefficient (R) of 0.500 and weighted average of 3.5%. Similarly, the statistical analysis conducted on geographies consisting of 411,278,726 people shows no correlation between the proportion of Immigrants from Korea and percentage of population with no schooling in the United States with a correlation coefficient (R) of -0.019 and weighted average of 2.0%, a difference of 73.0%.
No Schooling Completed Correlation Summary
| Measurement | Immigrants from Cabo Verde | Immigrants from Korea |
| Minimum | 0.088% | 0.20% |
| Maximum | 5.3% | 6.4% |
| Range | 5.2% | 6.2% |
| Mean | 2.9% | 1.9% |
| Median | 2.8% | 1.8% |
| Interquartile 25% (IQ1) | 2.0% | 1.0% |
| Interquartile 75% (IQ3) | 4.0% | 2.2% |
| Interquartile Range (IQR) | 2.0% | 1.2% |
| Standard Deviation (Sample) | 1.3% | 1.3% |
| Standard Deviation (Population) | 1.3% | 1.2% |
Similar Demographics by No Schooling Completed
Demographics Similar to Immigrants from Cabo Verde by No Schooling Completed
In terms of no schooling completed, the demographic groups most similar to Immigrants from Cabo Verde are Bangladeshi (3.5%, a difference of 0.23%), Yakama (3.6%, a difference of 0.55%), Immigrants from Fiji (3.5%, a difference of 0.71%), Immigrants from Cambodia (3.5%, a difference of 1.1%), and Immigrants from Guatemala (3.6%, a difference of 1.2%).
| Demographics | Rating | Rank | No Schooling Completed |
| Immigrants | Armenia | 0.0 /100 | #330 | Tragic 3.3% |
| Japanese | 0.0 /100 | #331 | Tragic 3.3% |
| Central Americans | 0.0 /100 | #332 | Tragic 3.4% |
| Immigrants | Dominican Republic | 0.0 /100 | #333 | Tragic 3.4% |
| Guatemalans | 0.0 /100 | #334 | Tragic 3.5% |
| Immigrants | Cambodia | 0.0 /100 | #335 | Tragic 3.5% |
| Immigrants | Fiji | 0.0 /100 | #336 | Tragic 3.5% |
| Immigrants | Cabo Verde | 0.0 /100 | #337 | Tragic 3.5% |
| Bangladeshis | 0.0 /100 | #338 | Tragic 3.5% |
| Yakama | 0.0 /100 | #339 | Tragic 3.6% |
| Immigrants | Guatemala | 0.0 /100 | #340 | Tragic 3.6% |
| Immigrants | Central America | 0.0 /100 | #341 | Tragic 3.6% |
| Immigrants | Mexico | 0.0 /100 | #342 | Tragic 3.6% |
| Salvadorans | 0.0 /100 | #343 | Tragic 3.7% |
| Nepalese | 0.0 /100 | #344 | Tragic 3.8% |
Demographics Similar to Immigrants from Korea by No Schooling Completed
In terms of no schooling completed, the demographic groups most similar to Immigrants from Korea are Immigrants from Sri Lanka (2.0%, a difference of 0.040%), Immigrants from Spain (2.0%, a difference of 0.050%), Chilean (2.0%, a difference of 0.080%), Immigrants from Russia (2.0%, a difference of 0.14%), and Kenyan (2.0%, a difference of 0.16%).
| Demographics | Rating | Rank | No Schooling Completed |
| Immigrants | Jordan | 70.9 /100 | #151 | Good 2.0% |
| Immigrants | Eastern Europe | 70.4 /100 | #152 | Good 2.0% |
| Immigrants | Italy | 68.9 /100 | #153 | Good 2.0% |
| Immigrants | Venezuela | 68.5 /100 | #154 | Good 2.0% |
| Immigrants | Russia | 67.6 /100 | #155 | Good 2.0% |
| Chileans | 67.2 /100 | #156 | Good 2.0% |
| Immigrants | Sri Lanka | 67.0 /100 | #157 | Good 2.0% |
| Immigrants | Korea | 66.7 /100 | #158 | Good 2.0% |
| Immigrants | Spain | 66.4 /100 | #159 | Good 2.0% |
| Kenyans | 65.7 /100 | #160 | Good 2.0% |
| Ugandans | 64.6 /100 | #161 | Good 2.0% |
| Immigrants | Brazil | 63.8 /100 | #162 | Good 2.1% |
| Albanians | 62.2 /100 | #163 | Good 2.1% |
| Comanche | 60.7 /100 | #164 | Good 2.1% |
| Brazilians | 60.2 /100 | #165 | Good 2.1% |