Pakistani vs Immigrants from Korea No Schooling Completed
COMPARE
Pakistani
Immigrants from Korea
No Schooling Completed
No Schooling Completed Comparison
Pakistanis
Immigrants from Korea
2.1%
NO SCHOOLING COMPLETED
44.7/ 100
METRIC RATING
178th/ 347
METRIC RANK
2.0%
NO SCHOOLING COMPLETED
66.7/ 100
METRIC RATING
158th/ 347
METRIC RANK
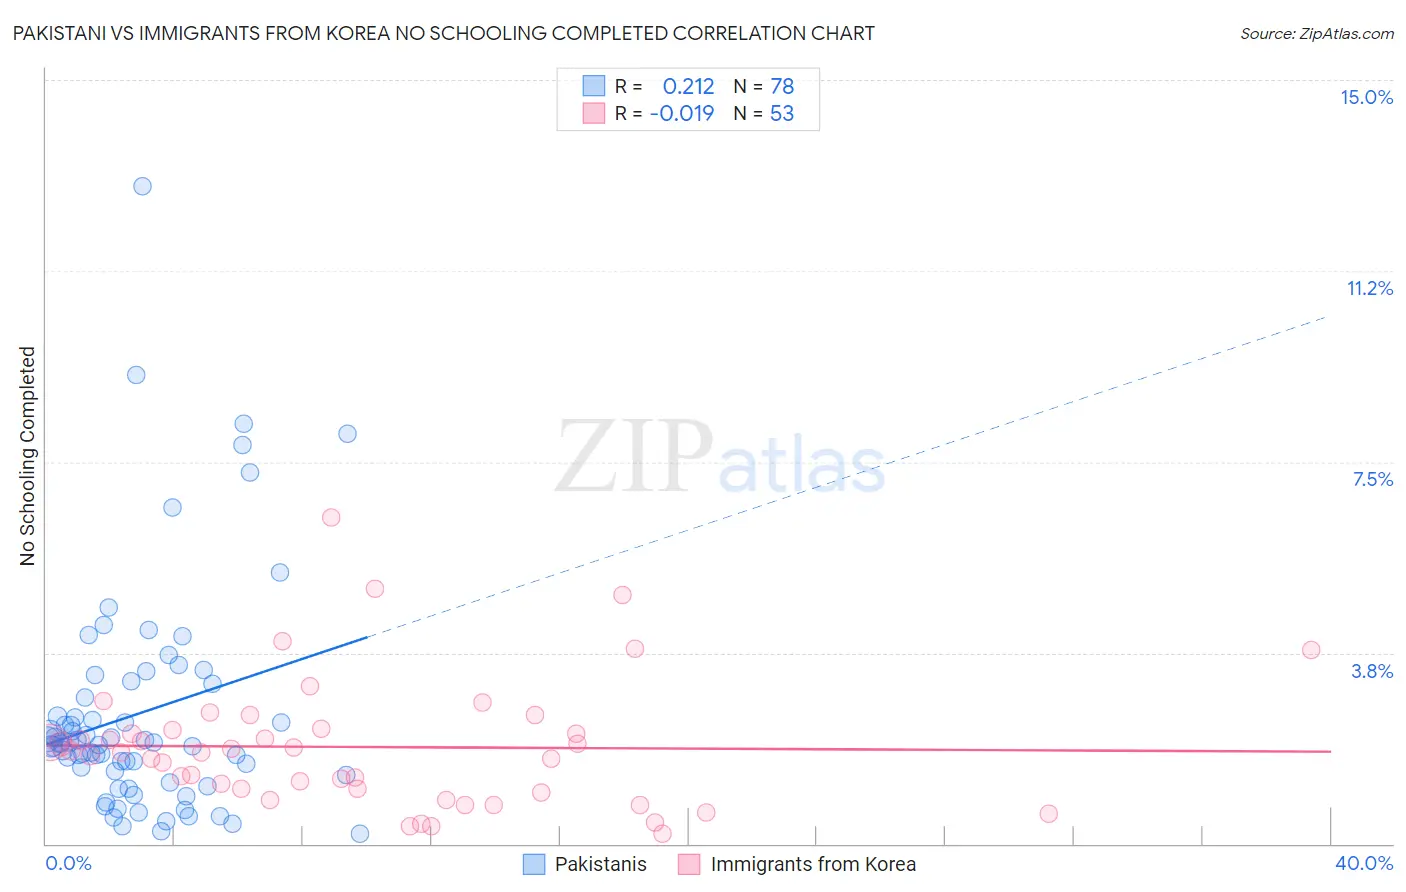
Pakistani vs Immigrants from Korea No Schooling Completed Correlation Chart
The statistical analysis conducted on geographies consisting of 333,015,834 people shows a weak positive correlation between the proportion of Pakistanis and percentage of population with no schooling in the United States with a correlation coefficient (R) of 0.212 and weighted average of 2.1%. Similarly, the statistical analysis conducted on geographies consisting of 411,278,726 people shows no correlation between the proportion of Immigrants from Korea and percentage of population with no schooling in the United States with a correlation coefficient (R) of -0.019 and weighted average of 2.0%, a difference of 3.1%.
No Schooling Completed Correlation Summary
| Measurement | Pakistani | Immigrants from Korea |
| Minimum | 0.20% | 0.20% |
| Maximum | 12.9% | 6.4% |
| Range | 12.7% | 6.2% |
| Mean | 2.6% | 1.9% |
| Median | 2.0% | 1.8% |
| Interquartile 25% (IQ1) | 1.3% | 1.0% |
| Interquartile 75% (IQ3) | 3.1% | 2.2% |
| Interquartile Range (IQR) | 1.8% | 1.2% |
| Standard Deviation (Sample) | 2.3% | 1.3% |
| Standard Deviation (Population) | 2.2% | 1.2% |
Demographics Similar to Pakistanis and Immigrants from Korea by No Schooling Completed
In terms of no schooling completed, the demographic groups most similar to Pakistanis are Arapaho (2.1%, a difference of 0.040%), Panamanian (2.1%, a difference of 0.060%), Arab (2.1%, a difference of 0.23%), Immigrants from Micronesia (2.1%, a difference of 0.71%), and Immigrants from Belarus (2.1%, a difference of 0.95%). Similarly, the demographic groups most similar to Immigrants from Korea are Immigrants from Spain (2.0%, a difference of 0.050%), Kenyan (2.0%, a difference of 0.16%), Ugandan (2.0%, a difference of 0.33%), Immigrants from Brazil (2.1%, a difference of 0.44%), and Albanian (2.1%, a difference of 0.68%).
| Demographics | Rating | Rank | No Schooling Completed |
| Immigrants | Korea | 66.7 /100 | #158 | Good 2.0% |
| Immigrants | Spain | 66.4 /100 | #159 | Good 2.0% |
| Kenyans | 65.7 /100 | #160 | Good 2.0% |
| Ugandans | 64.6 /100 | #161 | Good 2.0% |
| Immigrants | Brazil | 63.8 /100 | #162 | Good 2.1% |
| Albanians | 62.2 /100 | #163 | Good 2.1% |
| Comanche | 60.7 /100 | #164 | Good 2.1% |
| Brazilians | 60.2 /100 | #165 | Good 2.1% |
| Dutch West Indians | 59.9 /100 | #166 | Average 2.1% |
| Egyptians | 59.2 /100 | #167 | Average 2.1% |
| Cheyenne | 58.6 /100 | #168 | Average 2.1% |
| Apache | 56.7 /100 | #169 | Average 2.1% |
| Argentineans | 56.0 /100 | #170 | Average 2.1% |
| Immigrants | Poland | 55.2 /100 | #171 | Average 2.1% |
| Immigrants | Argentina | 52.7 /100 | #172 | Average 2.1% |
| Immigrants | Belarus | 51.8 /100 | #173 | Average 2.1% |
| Immigrants | Micronesia | 50.0 /100 | #174 | Average 2.1% |
| Arabs | 46.4 /100 | #175 | Average 2.1% |
| Panamanians | 45.2 /100 | #176 | Average 2.1% |
| Arapaho | 45.0 /100 | #177 | Average 2.1% |
| Pakistanis | 44.7 /100 | #178 | Average 2.1% |