Kenyan vs Immigrants from Jamaica 11th Grade
COMPARE
Kenyan
Immigrants from Jamaica
11th Grade
11th Grade Comparison
Kenyans
Immigrants from Jamaica
92.9%
11TH GRADE
82.0/ 100
METRIC RATING
142nd/ 347
METRIC RANK
91.2%
11TH GRADE
0.3/ 100
METRIC RATING
267th/ 347
METRIC RANK
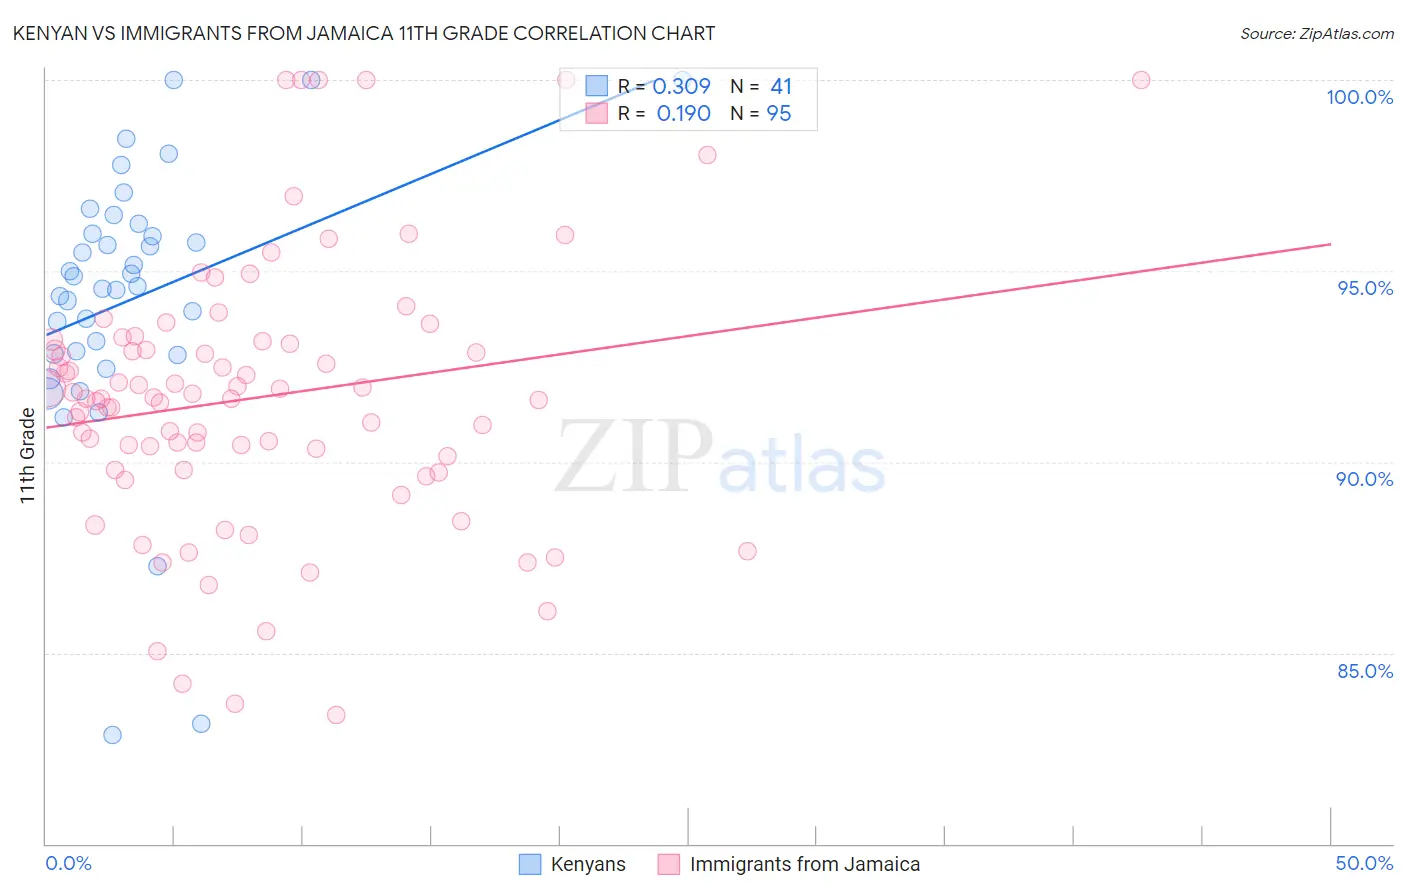
Kenyan vs Immigrants from Jamaica 11th Grade Correlation Chart
The statistical analysis conducted on geographies consisting of 168,244,042 people shows a mild positive correlation between the proportion of Kenyans and percentage of population with at least 11th grade education in the United States with a correlation coefficient (R) of 0.309 and weighted average of 92.9%. Similarly, the statistical analysis conducted on geographies consisting of 301,829,550 people shows a poor positive correlation between the proportion of Immigrants from Jamaica and percentage of population with at least 11th grade education in the United States with a correlation coefficient (R) of 0.190 and weighted average of 91.2%, a difference of 1.8%.
11th Grade Correlation Summary
| Measurement | Kenyan | Immigrants from Jamaica |
| Minimum | 82.9% | 83.4% |
| Maximum | 100.0% | 100.0% |
| Range | 17.1% | 16.6% |
| Mean | 94.3% | 91.7% |
| Median | 94.6% | 91.7% |
| Interquartile 25% (IQ1) | 92.8% | 89.8% |
| Interquartile 75% (IQ3) | 96.1% | 93.2% |
| Interquartile Range (IQR) | 3.3% | 3.4% |
| Standard Deviation (Sample) | 3.6% | 3.5% |
| Standard Deviation (Population) | 3.6% | 3.5% |
Similar Demographics by 11th Grade
Demographics Similar to Kenyans by 11th Grade
In terms of 11th grade, the demographic groups most similar to Kenyans are Ugandan (92.9%, a difference of 0.010%), Venezuelan (92.9%, a difference of 0.020%), Chilean (92.9%, a difference of 0.020%), Assyrian/Chaldean/Syriac (92.8%, a difference of 0.030%), and Crow (92.9%, a difference of 0.040%).
| Demographics | Rating | Rank | 11th Grade |
| Immigrants | Italy | 86.6 /100 | #135 | Excellent 92.9% |
| Cree | 85.9 /100 | #136 | Excellent 92.9% |
| Arabs | 85.4 /100 | #137 | Excellent 92.9% |
| Immigrants | Brazil | 85.1 /100 | #138 | Excellent 92.9% |
| Crow | 84.1 /100 | #139 | Excellent 92.9% |
| Venezuelans | 83.4 /100 | #140 | Excellent 92.9% |
| Chileans | 83.0 /100 | #141 | Excellent 92.9% |
| Kenyans | 82.0 /100 | #142 | Excellent 92.9% |
| Ugandans | 81.4 /100 | #143 | Excellent 92.9% |
| Assyrians/Chaldeans/Syriacs | 80.5 /100 | #144 | Excellent 92.8% |
| Pakistanis | 79.6 /100 | #145 | Good 92.8% |
| Iroquois | 79.1 /100 | #146 | Good 92.8% |
| Immigrants | Kenya | 78.7 /100 | #147 | Good 92.8% |
| Hmong | 78.6 /100 | #148 | Good 92.8% |
| Immigrants | Poland | 78.5 /100 | #149 | Good 92.8% |
Demographics Similar to Immigrants from Jamaica by 11th Grade
In terms of 11th grade, the demographic groups most similar to Immigrants from Jamaica are Immigrants from Western Africa (91.2%, a difference of 0.010%), Yup'ik (91.2%, a difference of 0.030%), Pueblo (91.2%, a difference of 0.030%), Immigrants from Ghana (91.2%, a difference of 0.050%), and U.S. Virgin Islander (91.1%, a difference of 0.070%).
| Demographics | Rating | Rank | 11th Grade |
| Spanish Americans | 0.6 /100 | #260 | Tragic 91.4% |
| Taiwanese | 0.6 /100 | #261 | Tragic 91.3% |
| Immigrants | Uruguay | 0.5 /100 | #262 | Tragic 91.3% |
| Immigrants | Ghana | 0.3 /100 | #263 | Tragic 91.2% |
| Yup'ik | 0.3 /100 | #264 | Tragic 91.2% |
| Pueblo | 0.3 /100 | #265 | Tragic 91.2% |
| Immigrants | Western Africa | 0.3 /100 | #266 | Tragic 91.2% |
| Immigrants | Jamaica | 0.3 /100 | #267 | Tragic 91.2% |
| U.S. Virgin Islanders | 0.2 /100 | #268 | Tragic 91.1% |
| Ute | 0.2 /100 | #269 | Tragic 91.1% |
| Trinidadians and Tobagonians | 0.2 /100 | #270 | Tragic 91.1% |
| Immigrants | Peru | 0.1 /100 | #271 | Tragic 91.0% |
| West Indians | 0.1 /100 | #272 | Tragic 91.0% |
| Paiute | 0.1 /100 | #273 | Tragic 91.0% |
| Immigrants | Trinidad and Tobago | 0.1 /100 | #274 | Tragic 90.9% |