Canadian vs Immigrants from Jamaica 11th Grade
COMPARE
Canadian
Immigrants from Jamaica
11th Grade
11th Grade Comparison
Canadians
Immigrants from Jamaica
93.7%
11TH GRADE
99.5/ 100
METRIC RATING
80th/ 347
METRIC RANK
91.2%
11TH GRADE
0.3/ 100
METRIC RATING
267th/ 347
METRIC RANK
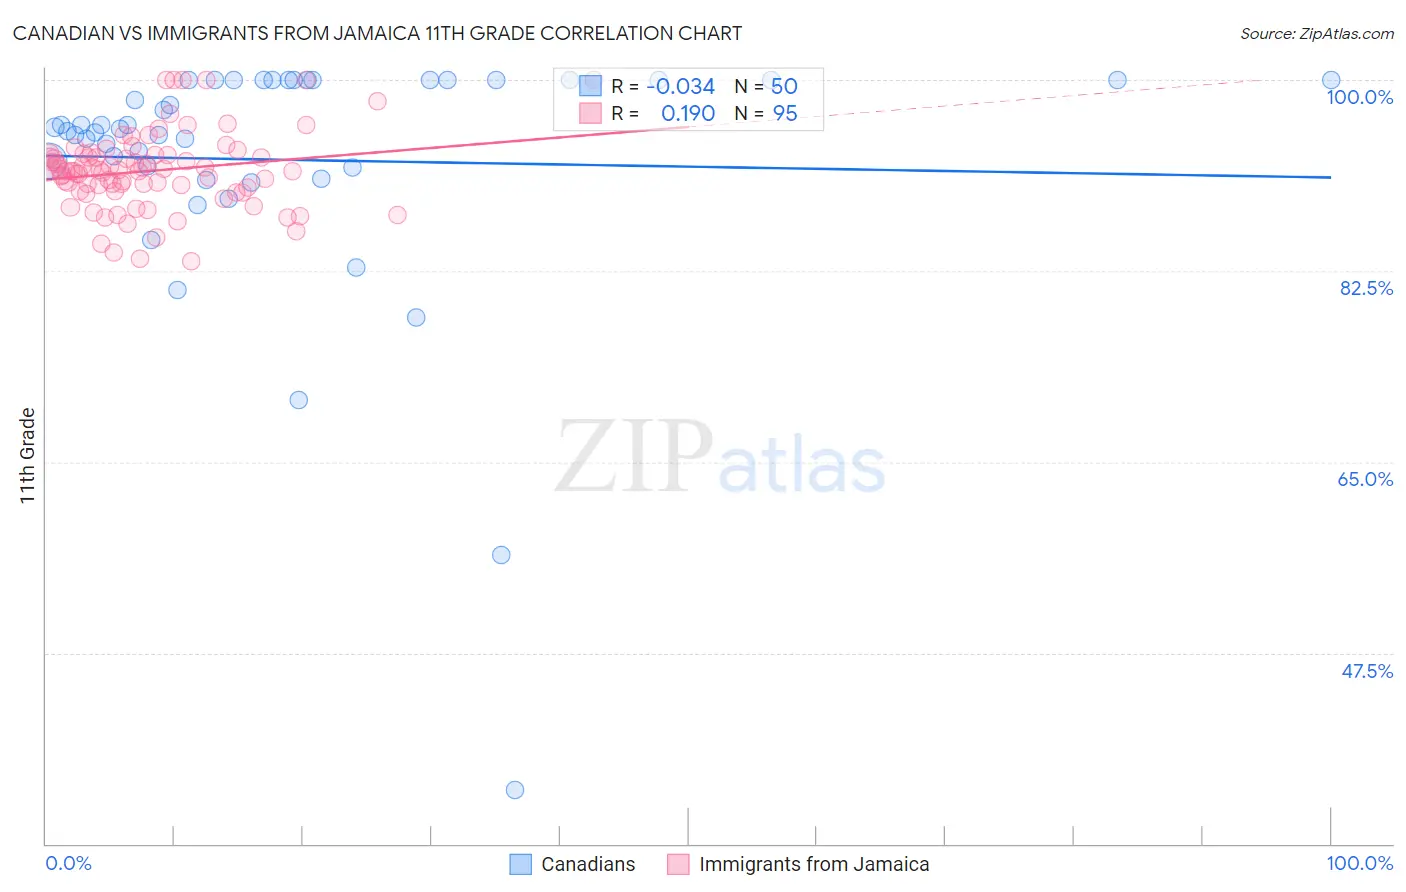
Canadian vs Immigrants from Jamaica 11th Grade Correlation Chart
The statistical analysis conducted on geographies consisting of 437,556,598 people shows no correlation between the proportion of Canadians and percentage of population with at least 11th grade education in the United States with a correlation coefficient (R) of -0.034 and weighted average of 93.7%. Similarly, the statistical analysis conducted on geographies consisting of 301,829,550 people shows a poor positive correlation between the proportion of Immigrants from Jamaica and percentage of population with at least 11th grade education in the United States with a correlation coefficient (R) of 0.190 and weighted average of 91.2%, a difference of 2.8%.
11th Grade Correlation Summary
| Measurement | Canadian | Immigrants from Jamaica |
| Minimum | 34.9% | 83.4% |
| Maximum | 100.0% | 100.0% |
| Range | 65.1% | 16.6% |
| Mean | 92.7% | 91.7% |
| Median | 95.6% | 91.7% |
| Interquartile 25% (IQ1) | 92.0% | 89.8% |
| Interquartile 75% (IQ3) | 100.0% | 93.2% |
| Interquartile Range (IQR) | 8.0% | 3.4% |
| Standard Deviation (Sample) | 11.7% | 3.5% |
| Standard Deviation (Population) | 11.6% | 3.5% |
Similar Demographics by 11th Grade
Demographics Similar to Canadians by 11th Grade
In terms of 11th grade, the demographic groups most similar to Canadians are Immigrants from Moldova (93.7%, a difference of 0.0%), Immigrants from Denmark (93.7%, a difference of 0.020%), Celtic (93.7%, a difference of 0.030%), Aleut (93.7%, a difference of 0.030%), and Soviet Union (93.7%, a difference of 0.030%).
| Demographics | Rating | Rank | 11th Grade |
| Romanians | 99.6 /100 | #73 | Exceptional 93.8% |
| Immigrants | Czechoslovakia | 99.6 /100 | #74 | Exceptional 93.8% |
| Immigrants | Latvia | 99.6 /100 | #75 | Exceptional 93.8% |
| Celtics | 99.5 /100 | #76 | Exceptional 93.7% |
| Aleuts | 99.5 /100 | #77 | Exceptional 93.7% |
| Soviet Union | 99.5 /100 | #78 | Exceptional 93.7% |
| Immigrants | Denmark | 99.5 /100 | #79 | Exceptional 93.7% |
| Canadians | 99.5 /100 | #80 | Exceptional 93.7% |
| Immigrants | Moldova | 99.5 /100 | #81 | Exceptional 93.7% |
| Immigrants | Saudi Arabia | 99.3 /100 | #82 | Exceptional 93.7% |
| Icelanders | 99.3 /100 | #83 | Exceptional 93.6% |
| Immigrants | Taiwan | 99.3 /100 | #84 | Exceptional 93.6% |
| Immigrants | Switzerland | 99.3 /100 | #85 | Exceptional 93.6% |
| Immigrants | South Central Asia | 99.2 /100 | #86 | Exceptional 93.6% |
| Immigrants | Western Europe | 99.2 /100 | #87 | Exceptional 93.6% |
Demographics Similar to Immigrants from Jamaica by 11th Grade
In terms of 11th grade, the demographic groups most similar to Immigrants from Jamaica are Immigrants from Western Africa (91.2%, a difference of 0.010%), Yup'ik (91.2%, a difference of 0.030%), Pueblo (91.2%, a difference of 0.030%), Immigrants from Ghana (91.2%, a difference of 0.050%), and U.S. Virgin Islander (91.1%, a difference of 0.070%).
| Demographics | Rating | Rank | 11th Grade |
| Spanish Americans | 0.6 /100 | #260 | Tragic 91.4% |
| Taiwanese | 0.6 /100 | #261 | Tragic 91.3% |
| Immigrants | Uruguay | 0.5 /100 | #262 | Tragic 91.3% |
| Immigrants | Ghana | 0.3 /100 | #263 | Tragic 91.2% |
| Yup'ik | 0.3 /100 | #264 | Tragic 91.2% |
| Pueblo | 0.3 /100 | #265 | Tragic 91.2% |
| Immigrants | Western Africa | 0.3 /100 | #266 | Tragic 91.2% |
| Immigrants | Jamaica | 0.3 /100 | #267 | Tragic 91.2% |
| U.S. Virgin Islanders | 0.2 /100 | #268 | Tragic 91.1% |
| Ute | 0.2 /100 | #269 | Tragic 91.1% |
| Trinidadians and Tobagonians | 0.2 /100 | #270 | Tragic 91.1% |
| Immigrants | Peru | 0.1 /100 | #271 | Tragic 91.0% |
| West Indians | 0.1 /100 | #272 | Tragic 91.0% |
| Paiute | 0.1 /100 | #273 | Tragic 91.0% |
| Immigrants | Trinidad and Tobago | 0.1 /100 | #274 | Tragic 90.9% |