Mongolian vs Cambodian 11th Grade
COMPARE
Mongolian
Cambodian
11th Grade
11th Grade Comparison
Mongolians
Cambodians
93.0%
11TH GRADE
87.6/ 100
METRIC RATING
133rd/ 347
METRIC RANK
93.6%
11TH GRADE
99.2/ 100
METRIC RATING
88th/ 347
METRIC RANK
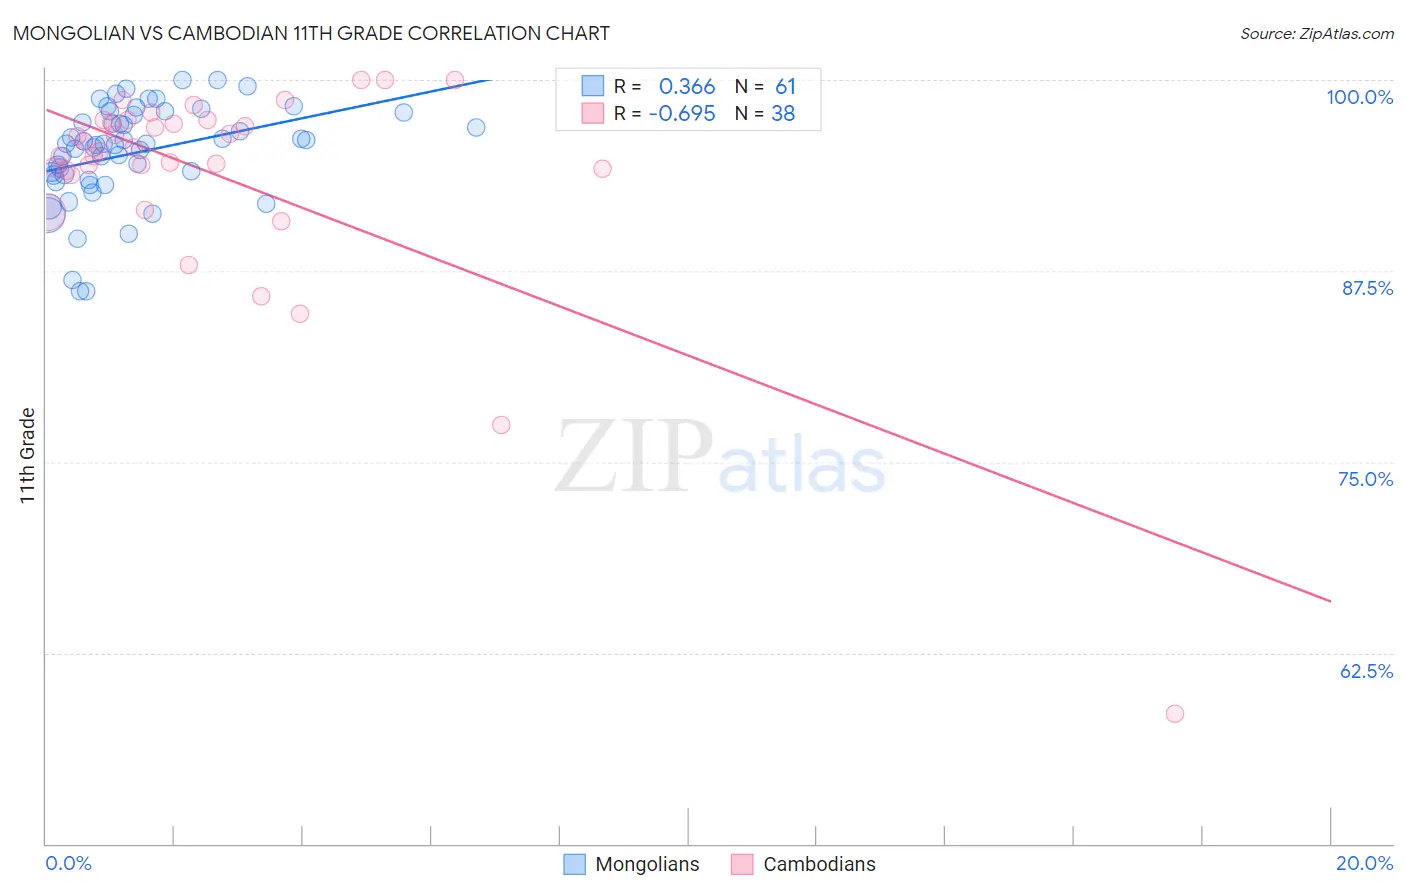
Mongolian vs Cambodian 11th Grade Correlation Chart
The statistical analysis conducted on geographies consisting of 140,362,004 people shows a mild positive correlation between the proportion of Mongolians and percentage of population with at least 11th grade education in the United States with a correlation coefficient (R) of 0.366 and weighted average of 93.0%. Similarly, the statistical analysis conducted on geographies consisting of 102,514,976 people shows a significant negative correlation between the proportion of Cambodians and percentage of population with at least 11th grade education in the United States with a correlation coefficient (R) of -0.695 and weighted average of 93.6%, a difference of 0.71%.
11th Grade Correlation Summary
| Measurement | Mongolian | Cambodian |
| Minimum | 86.1% | 58.5% |
| Maximum | 100.0% | 100.0% |
| Range | 13.9% | 41.5% |
| Mean | 95.2% | 93.7% |
| Median | 95.8% | 95.5% |
| Interquartile 25% (IQ1) | 93.6% | 94.1% |
| Interquartile 75% (IQ3) | 97.8% | 97.4% |
| Interquartile Range (IQR) | 4.2% | 3.3% |
| Standard Deviation (Sample) | 3.2% | 7.4% |
| Standard Deviation (Population) | 3.2% | 7.3% |
Similar Demographics by 11th Grade
Demographics Similar to Mongolians by 11th Grade
In terms of 11th grade, the demographic groups most similar to Mongolians are Delaware (93.0%, a difference of 0.010%), Immigrants from Italy (92.9%, a difference of 0.020%), Immigrants from Bosnia and Herzegovina (93.0%, a difference of 0.030%), Cree (92.9%, a difference of 0.030%), and Arab (92.9%, a difference of 0.040%).
| Demographics | Rating | Rank | 11th Grade |
| Basques | 95.2 /100 | #126 | Exceptional 93.2% |
| Immigrants | Kazakhstan | 92.4 /100 | #127 | Exceptional 93.1% |
| Immigrants | Jordan | 92.4 /100 | #128 | Exceptional 93.1% |
| Immigrants | Ukraine | 89.8 /100 | #129 | Excellent 93.0% |
| Albanians | 89.5 /100 | #130 | Excellent 93.0% |
| Egyptians | 89.5 /100 | #131 | Excellent 93.0% |
| Immigrants | Bosnia and Herzegovina | 89.0 /100 | #132 | Excellent 93.0% |
| Mongolians | 87.6 /100 | #133 | Excellent 93.0% |
| Delaware | 87.3 /100 | #134 | Excellent 93.0% |
| Immigrants | Italy | 86.6 /100 | #135 | Excellent 92.9% |
| Cree | 85.9 /100 | #136 | Excellent 92.9% |
| Arabs | 85.4 /100 | #137 | Excellent 92.9% |
| Immigrants | Brazil | 85.1 /100 | #138 | Excellent 92.9% |
| Crow | 84.1 /100 | #139 | Excellent 92.9% |
| Venezuelans | 83.4 /100 | #140 | Excellent 92.9% |
Demographics Similar to Cambodians by 11th Grade
In terms of 11th grade, the demographic groups most similar to Cambodians are Immigrants from South Central Asia (93.6%, a difference of 0.0%), Immigrants from Western Europe (93.6%, a difference of 0.0%), Burmese (93.6%, a difference of 0.0%), Immigrants from Switzerland (93.6%, a difference of 0.010%), and Ottawa (93.6%, a difference of 0.010%).
| Demographics | Rating | Rank | 11th Grade |
| Immigrants | Moldova | 99.5 /100 | #81 | Exceptional 93.7% |
| Immigrants | Saudi Arabia | 99.3 /100 | #82 | Exceptional 93.7% |
| Icelanders | 99.3 /100 | #83 | Exceptional 93.6% |
| Immigrants | Taiwan | 99.3 /100 | #84 | Exceptional 93.6% |
| Immigrants | Switzerland | 99.3 /100 | #85 | Exceptional 93.6% |
| Immigrants | South Central Asia | 99.2 /100 | #86 | Exceptional 93.6% |
| Immigrants | Western Europe | 99.2 /100 | #87 | Exceptional 93.6% |
| Cambodians | 99.2 /100 | #88 | Exceptional 93.6% |
| Burmese | 99.2 /100 | #89 | Exceptional 93.6% |
| Ottawa | 99.2 /100 | #90 | Exceptional 93.6% |
| South Africans | 99.2 /100 | #91 | Exceptional 93.6% |
| Immigrants | Bulgaria | 99.1 /100 | #92 | Exceptional 93.6% |
| Puget Sound Salish | 99.1 /100 | #93 | Exceptional 93.6% |
| Swiss | 99.0 /100 | #94 | Exceptional 93.6% |
| Immigrants | France | 99.0 /100 | #95 | Exceptional 93.6% |