Thai vs South American Bachelor's Degree
COMPARE
Thai
South American
Bachelor's Degree
Bachelor's Degree Comparison
Thais
South Americans
50.1%
BACHELOR'S DEGREE
100.0/ 100
METRIC RATING
8th/ 347
METRIC RANK
38.9%
BACHELOR'S DEGREE
77.3/ 100
METRIC RATING
150th/ 347
METRIC RANK
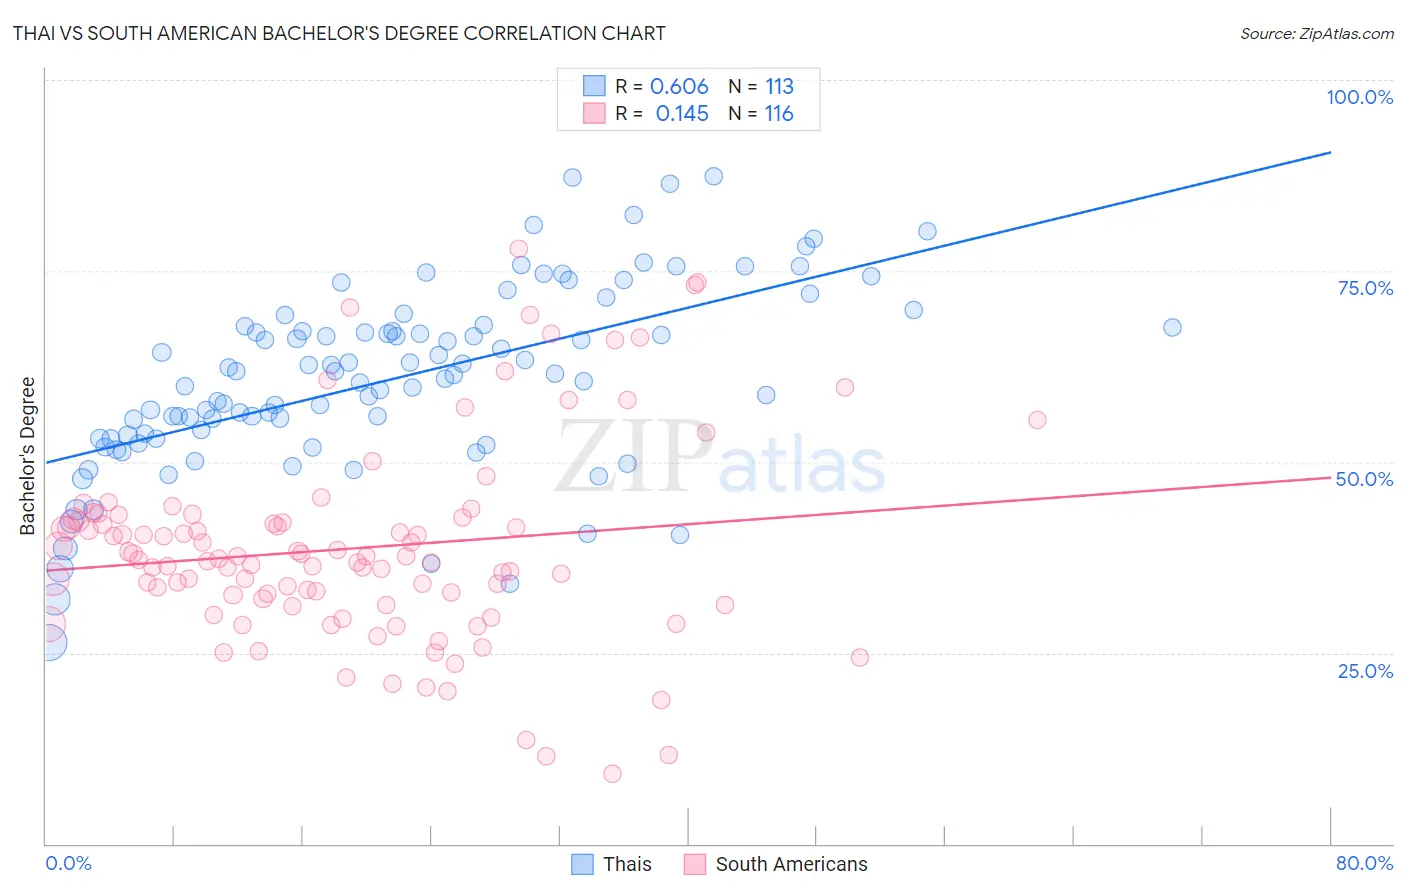
Thai vs South American Bachelor's Degree Correlation Chart
The statistical analysis conducted on geographies consisting of 475,734,010 people shows a significant positive correlation between the proportion of Thais and percentage of population with at least bachelor's degree education in the United States with a correlation coefficient (R) of 0.606 and weighted average of 50.1%. Similarly, the statistical analysis conducted on geographies consisting of 494,094,255 people shows a poor positive correlation between the proportion of South Americans and percentage of population with at least bachelor's degree education in the United States with a correlation coefficient (R) of 0.145 and weighted average of 38.9%, a difference of 28.7%.
Bachelor's Degree Correlation Summary
| Measurement | Thai | South American |
| Minimum | 26.3% | 9.1% |
| Maximum | 87.4% | 77.9% |
| Range | 61.1% | 68.8% |
| Mean | 60.8% | 38.6% |
| Median | 61.3% | 37.2% |
| Interquartile 25% (IQ1) | 53.0% | 31.7% |
| Interquartile 75% (IQ3) | 67.7% | 42.4% |
| Interquartile Range (IQR) | 14.7% | 10.7% |
| Standard Deviation (Sample) | 12.0% | 13.0% |
| Standard Deviation (Population) | 12.0% | 12.9% |
Similar Demographics by Bachelor's Degree
Demographics Similar to Thais by Bachelor's Degree
In terms of bachelor's degree, the demographic groups most similar to Thais are Immigrants from Israel (50.0%, a difference of 0.24%), Immigrants from Iran (50.3%, a difference of 0.37%), Okinawan (50.5%, a difference of 0.85%), Iranian (51.0%, a difference of 1.7%), and Immigrants from Taiwan (51.2%, a difference of 2.1%).
| Demographics | Rating | Rank | Bachelor's Degree |
| Filipinos | 100.0 /100 | #1 | Exceptional 52.7% |
| Immigrants | Singapore | 100.0 /100 | #2 | Exceptional 51.9% |
| Immigrants | India | 100.0 /100 | #3 | Exceptional 51.3% |
| Immigrants | Taiwan | 100.0 /100 | #4 | Exceptional 51.2% |
| Iranians | 100.0 /100 | #5 | Exceptional 51.0% |
| Okinawans | 100.0 /100 | #6 | Exceptional 50.5% |
| Immigrants | Iran | 100.0 /100 | #7 | Exceptional 50.3% |
| Thais | 100.0 /100 | #8 | Exceptional 50.1% |
| Immigrants | Israel | 100.0 /100 | #9 | Exceptional 50.0% |
| Cypriots | 100.0 /100 | #10 | Exceptional 49.0% |
| Immigrants | Australia | 100.0 /100 | #11 | Exceptional 48.5% |
| Immigrants | China | 100.0 /100 | #12 | Exceptional 48.4% |
| Immigrants | South Central Asia | 100.0 /100 | #13 | Exceptional 48.3% |
| Immigrants | Hong Kong | 100.0 /100 | #14 | Exceptional 48.2% |
| Immigrants | Eastern Asia | 100.0 /100 | #15 | Exceptional 48.1% |
Demographics Similar to South Americans by Bachelor's Degree
In terms of bachelor's degree, the demographic groups most similar to South Americans are Immigrants from Poland (39.0%, a difference of 0.030%), Immigrants from Africa (38.9%, a difference of 0.10%), Iraqi (39.0%, a difference of 0.11%), Sudanese (38.9%, a difference of 0.12%), and Slavic (38.9%, a difference of 0.18%).
| Demographics | Rating | Rank | Bachelor's Degree |
| Poles | 79.8 /100 | #143 | Good 39.1% |
| Immigrants | Afghanistan | 79.7 /100 | #144 | Good 39.1% |
| Slovenes | 79.5 /100 | #145 | Good 39.1% |
| Swedes | 79.2 /100 | #146 | Good 39.1% |
| Immigrants | Sierra Leone | 79.0 /100 | #147 | Good 39.0% |
| Iraqis | 78.1 /100 | #148 | Good 39.0% |
| Immigrants | Poland | 77.5 /100 | #149 | Good 39.0% |
| South Americans | 77.3 /100 | #150 | Good 38.9% |
| Immigrants | Africa | 76.5 /100 | #151 | Good 38.9% |
| Sudanese | 76.4 /100 | #152 | Good 38.9% |
| Slavs | 75.9 /100 | #153 | Good 38.9% |
| Canadians | 75.0 /100 | #154 | Good 38.8% |
| Immigrants | Kenya | 73.8 /100 | #155 | Good 38.8% |
| Kenyans | 72.5 /100 | #156 | Good 38.7% |
| Immigrants | South America | 70.1 /100 | #157 | Good 38.6% |