Immigrants from South Eastern Asia vs Immigrants from Northern Europe Bachelor's Degree
COMPARE
Immigrants from South Eastern Asia
Immigrants from Northern Europe
Bachelor's Degree
Bachelor's Degree Comparison
Immigrants from South Eastern Asia
Immigrants from Northern Europe
36.8%
BACHELOR'S DEGREE
25.4/ 100
METRIC RATING
201st/ 347
METRIC RANK
45.6%
BACHELOR'S DEGREE
100.0/ 100
METRIC RATING
33rd/ 347
METRIC RANK
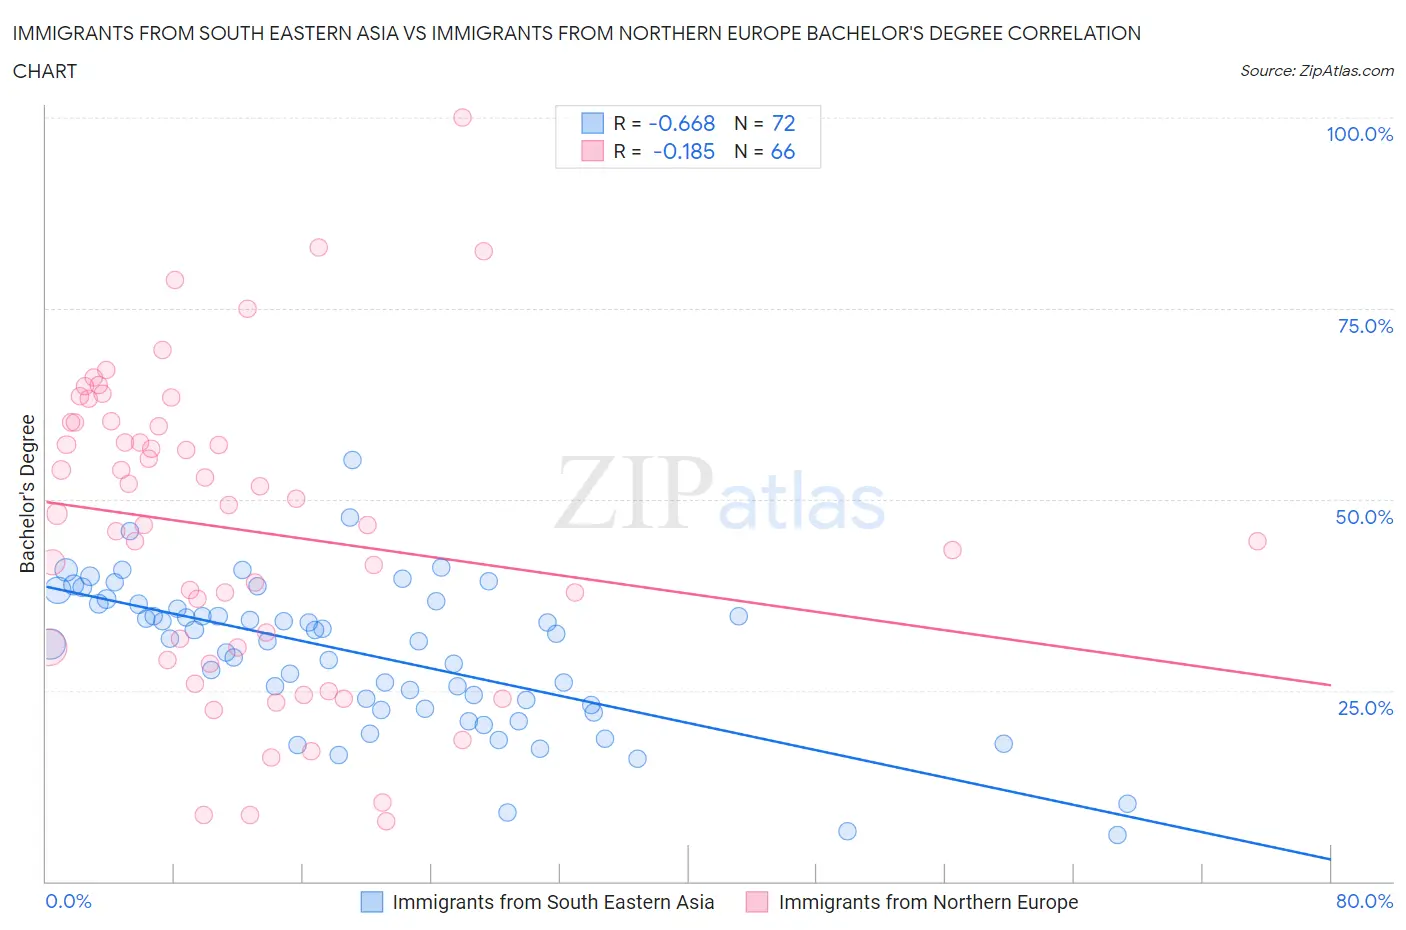
Immigrants from South Eastern Asia vs Immigrants from Northern Europe Bachelor's Degree Correlation Chart
The statistical analysis conducted on geographies consisting of 512,639,953 people shows a significant negative correlation between the proportion of Immigrants from South Eastern Asia and percentage of population with at least bachelor's degree education in the United States with a correlation coefficient (R) of -0.668 and weighted average of 36.8%. Similarly, the statistical analysis conducted on geographies consisting of 477,184,497 people shows a poor negative correlation between the proportion of Immigrants from Northern Europe and percentage of population with at least bachelor's degree education in the United States with a correlation coefficient (R) of -0.185 and weighted average of 45.6%, a difference of 23.9%.
Bachelor's Degree Correlation Summary
| Measurement | Immigrants from South Eastern Asia | Immigrants from Northern Europe |
| Minimum | 6.0% | 7.8% |
| Maximum | 55.1% | 100.0% |
| Range | 49.1% | 92.2% |
| Mean | 29.7% | 46.0% |
| Median | 31.6% | 47.4% |
| Interquartile 25% (IQ1) | 22.9% | 30.6% |
| Interquartile 75% (IQ3) | 36.3% | 60.1% |
| Interquartile Range (IQR) | 13.4% | 29.5% |
| Standard Deviation (Sample) | 9.7% | 20.0% |
| Standard Deviation (Population) | 9.6% | 19.8% |
Similar Demographics by Bachelor's Degree
Demographics Similar to Immigrants from South Eastern Asia by Bachelor's Degree
In terms of bachelor's degree, the demographic groups most similar to Immigrants from South Eastern Asia are Immigrants from Zaire (36.8%, a difference of 0.010%), Immigrants from Costa Rica (36.9%, a difference of 0.26%), Immigrants from Ghana (36.9%, a difference of 0.26%), Immigrants from Nigeria (36.7%, a difference of 0.31%), and Immigrants (36.7%, a difference of 0.35%).
| Demographics | Rating | Rank | Bachelor's Degree |
| Belgians | 29.9 /100 | #194 | Fair 37.0% |
| Koreans | 29.8 /100 | #195 | Fair 37.0% |
| Celtics | 29.5 /100 | #196 | Fair 37.0% |
| Czechoslovakians | 29.2 /100 | #197 | Fair 37.0% |
| Welsh | 29.1 /100 | #198 | Fair 37.0% |
| Immigrants | Costa Rica | 27.4 /100 | #199 | Fair 36.9% |
| Immigrants | Ghana | 27.4 /100 | #200 | Fair 36.9% |
| Immigrants | South Eastern Asia | 25.4 /100 | #201 | Fair 36.8% |
| Immigrants | Zaire | 25.3 /100 | #202 | Fair 36.8% |
| Immigrants | Nigeria | 23.1 /100 | #203 | Fair 36.7% |
| Immigrants | Immigrants | 22.8 /100 | #204 | Fair 36.7% |
| Finns | 22.2 /100 | #205 | Fair 36.7% |
| Spaniards | 21.2 /100 | #206 | Fair 36.6% |
| Immigrants | Middle Africa | 20.6 /100 | #207 | Fair 36.6% |
| Immigrants | Thailand | 19.4 /100 | #208 | Poor 36.5% |
Demographics Similar to Immigrants from Northern Europe by Bachelor's Degree
In terms of bachelor's degree, the demographic groups most similar to Immigrants from Northern Europe are Immigrants from Denmark (45.4%, a difference of 0.45%), Immigrants from Russia (45.4%, a difference of 0.48%), Mongolian (45.4%, a difference of 0.50%), Russian (45.3%, a difference of 0.65%), and Immigrants from Turkey (46.0%, a difference of 0.70%).
| Demographics | Rating | Rank | Bachelor's Degree |
| Immigrants | Japan | 100.0 /100 | #26 | Exceptional 46.8% |
| Immigrants | France | 100.0 /100 | #27 | Exceptional 46.4% |
| Turks | 100.0 /100 | #28 | Exceptional 46.2% |
| Israelis | 100.0 /100 | #29 | Exceptional 46.1% |
| Immigrants | Sri Lanka | 100.0 /100 | #30 | Exceptional 46.1% |
| Latvians | 100.0 /100 | #31 | Exceptional 46.1% |
| Immigrants | Turkey | 100.0 /100 | #32 | Exceptional 46.0% |
| Immigrants | Northern Europe | 100.0 /100 | #33 | Exceptional 45.6% |
| Immigrants | Denmark | 100.0 /100 | #34 | Exceptional 45.4% |
| Immigrants | Russia | 100.0 /100 | #35 | Exceptional 45.4% |
| Mongolians | 100.0 /100 | #36 | Exceptional 45.4% |
| Russians | 100.0 /100 | #37 | Exceptional 45.3% |
| Bulgarians | 100.0 /100 | #38 | Exceptional 45.3% |
| Immigrants | Latvia | 100.0 /100 | #39 | Exceptional 45.1% |
| Immigrants | Belarus | 100.0 /100 | #40 | Exceptional 45.0% |