Immigrants from Singapore vs Immigrants from Nicaragua Professional Degree
COMPARE
Immigrants from Singapore
Immigrants from Nicaragua
Professional Degree
Professional Degree Comparison
Immigrants from Singapore
Immigrants from Nicaragua
7.7%
PROFESSIONAL DEGREE
100.0/ 100
METRIC RATING
2nd/ 347
METRIC RANK
3.7%
PROFESSIONAL DEGREE
1.4/ 100
METRIC RATING
251st/ 347
METRIC RANK
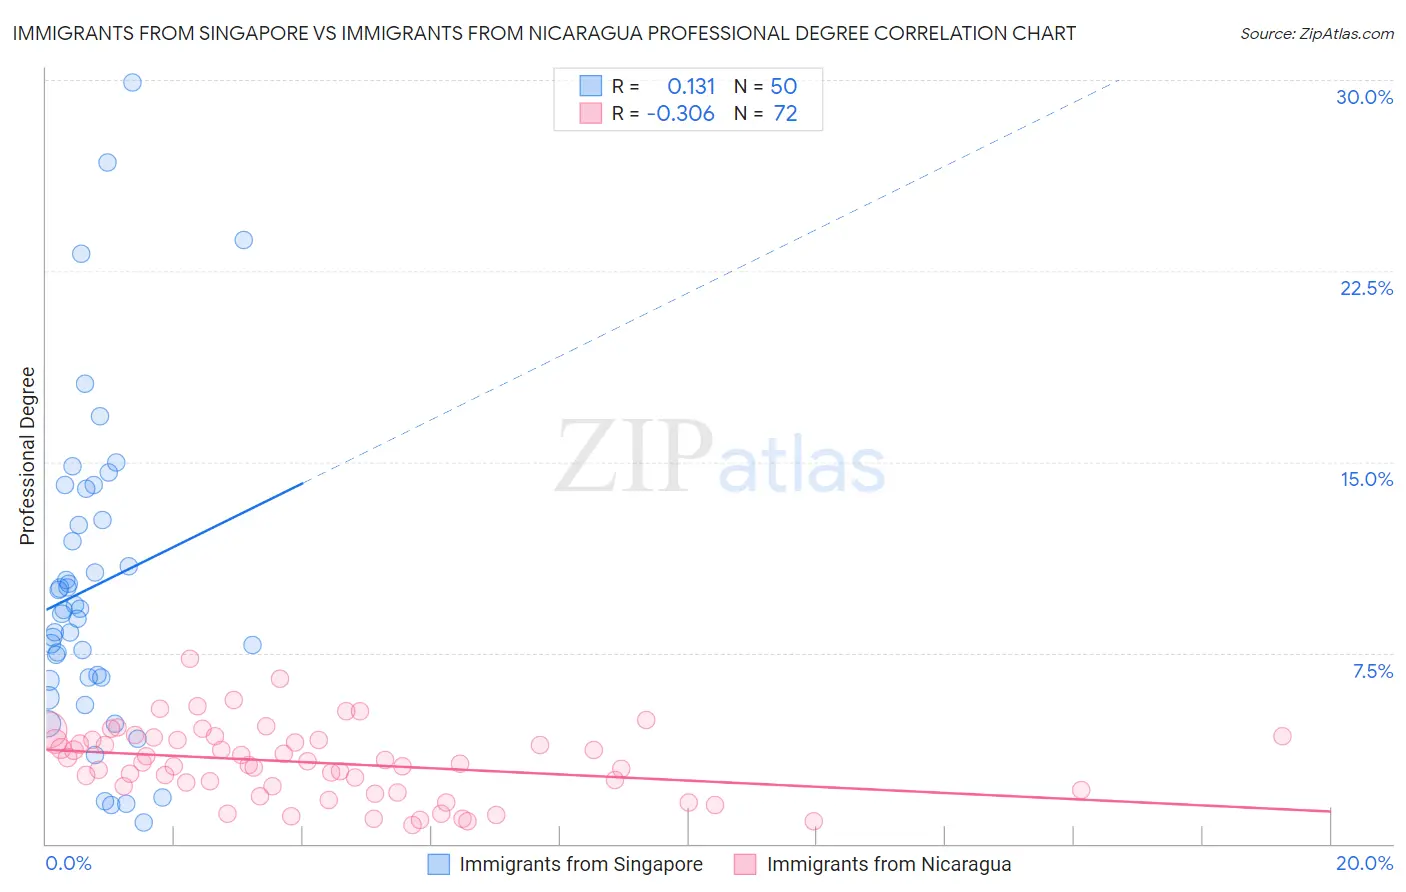
Immigrants from Singapore vs Immigrants from Nicaragua Professional Degree Correlation Chart
The statistical analysis conducted on geographies consisting of 137,446,133 people shows a poor positive correlation between the proportion of Immigrants from Singapore and percentage of population with at least professional degree education in the United States with a correlation coefficient (R) of 0.131 and weighted average of 7.7%. Similarly, the statistical analysis conducted on geographies consisting of 236,073,386 people shows a mild negative correlation between the proportion of Immigrants from Nicaragua and percentage of population with at least professional degree education in the United States with a correlation coefficient (R) of -0.306 and weighted average of 3.7%, a difference of 107.6%.
Professional Degree Correlation Summary
| Measurement | Immigrants from Singapore | Immigrants from Nicaragua |
| Minimum | 0.83% | 0.72% |
| Maximum | 29.9% | 7.2% |
| Range | 29.1% | 6.5% |
| Mean | 10.1% | 3.2% |
| Median | 9.1% | 3.2% |
| Interquartile 25% (IQ1) | 6.5% | 2.2% |
| Interquartile 75% (IQ3) | 12.7% | 4.1% |
| Interquartile Range (IQR) | 6.2% | 1.9% |
| Standard Deviation (Sample) | 6.2% | 1.4% |
| Standard Deviation (Population) | 6.2% | 1.4% |
Similar Demographics by Professional Degree
Demographics Similar to Immigrants from Singapore by Professional Degree
In terms of professional degree, the demographic groups most similar to Immigrants from Singapore are Immigrants from Israel (7.9%, a difference of 1.4%), Iranian (7.6%, a difference of 1.6%), Filipino (7.6%, a difference of 2.4%), Immigrants from Iran (7.3%, a difference of 5.7%), and Okinawan (7.3%, a difference of 5.8%).
| Demographics | Rating | Rank | Professional Degree |
| Immigrants | Israel | 100.0 /100 | #1 | Exceptional 7.9% |
| Immigrants | Singapore | 100.0 /100 | #2 | Exceptional 7.7% |
| Iranians | 100.0 /100 | #3 | Exceptional 7.6% |
| Filipinos | 100.0 /100 | #4 | Exceptional 7.6% |
| Immigrants | Iran | 100.0 /100 | #5 | Exceptional 7.3% |
| Okinawans | 100.0 /100 | #6 | Exceptional 7.3% |
| Eastern Europeans | 100.0 /100 | #7 | Exceptional 7.1% |
| Immigrants | Switzerland | 100.0 /100 | #8 | Exceptional 7.1% |
| Immigrants | Taiwan | 100.0 /100 | #9 | Exceptional 7.1% |
| Immigrants | Belgium | 100.0 /100 | #10 | Exceptional 7.0% |
| Cypriots | 100.0 /100 | #11 | Exceptional 6.9% |
| Israelis | 100.0 /100 | #12 | Exceptional 6.9% |
| Immigrants | Australia | 100.0 /100 | #13 | Exceptional 6.9% |
| Immigrants | France | 100.0 /100 | #14 | Exceptional 6.8% |
| Immigrants | China | 100.0 /100 | #15 | Exceptional 6.7% |
Demographics Similar to Immigrants from Nicaragua by Professional Degree
In terms of professional degree, the demographic groups most similar to Immigrants from Nicaragua are Jamaican (3.7%, a difference of 0.14%), Pueblo (3.7%, a difference of 0.24%), Immigrants from Fiji (3.7%, a difference of 0.25%), Immigrants from Grenada (3.7%, a difference of 0.31%), and Tongan (3.7%, a difference of 0.39%).
| Demographics | Rating | Rank | Professional Degree |
| Immigrants | Bahamas | 2.0 /100 | #244 | Tragic 3.8% |
| French American Indians | 1.7 /100 | #245 | Tragic 3.8% |
| Marshallese | 1.7 /100 | #246 | Tragic 3.8% |
| Guyanese | 1.6 /100 | #247 | Tragic 3.8% |
| Hmong | 1.6 /100 | #248 | Tragic 3.7% |
| Immigrants | Grenada | 1.5 /100 | #249 | Tragic 3.7% |
| Immigrants | Fiji | 1.5 /100 | #250 | Tragic 3.7% |
| Immigrants | Nicaragua | 1.4 /100 | #251 | Tragic 3.7% |
| Jamaicans | 1.4 /100 | #252 | Tragic 3.7% |
| Pueblo | 1.4 /100 | #253 | Tragic 3.7% |
| Tongans | 1.3 /100 | #254 | Tragic 3.7% |
| Osage | 1.2 /100 | #255 | Tragic 3.7% |
| Iroquois | 1.2 /100 | #256 | Tragic 3.7% |
| Bahamians | 1.1 /100 | #257 | Tragic 3.7% |
| Immigrants | St. Vincent and the Grenadines | 1.1 /100 | #258 | Tragic 3.7% |