Immigrants from Russia vs Immigrants from Nicaragua Professional Degree
COMPARE
Immigrants from Russia
Immigrants from Nicaragua
Professional Degree
Professional Degree Comparison
Immigrants from Russia
Immigrants from Nicaragua
6.0%
PROFESSIONAL DEGREE
100.0/ 100
METRIC RATING
36th/ 347
METRIC RANK
3.7%
PROFESSIONAL DEGREE
1.4/ 100
METRIC RATING
251st/ 347
METRIC RANK
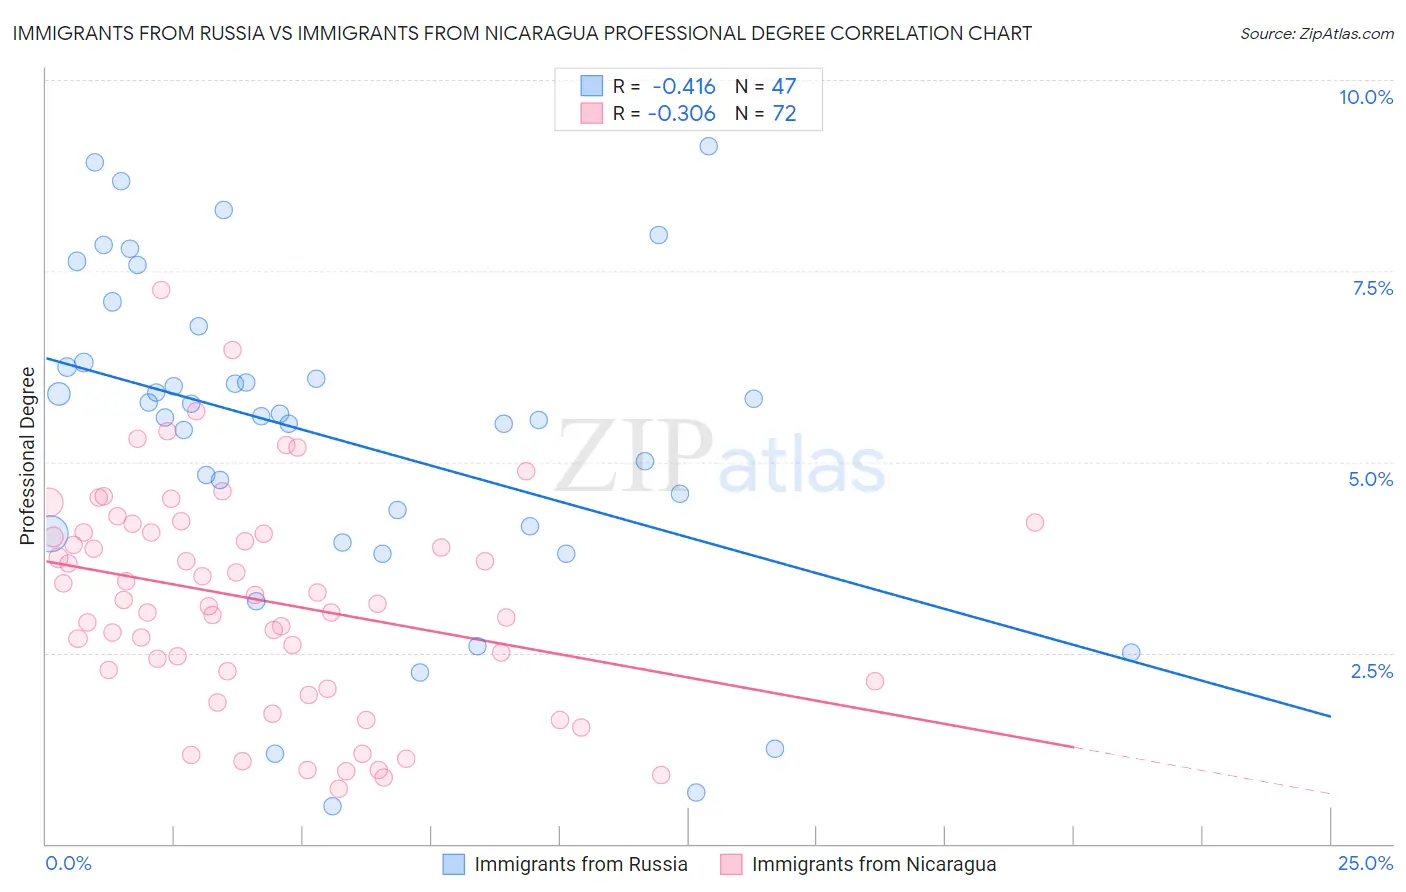
Immigrants from Russia vs Immigrants from Nicaragua Professional Degree Correlation Chart
The statistical analysis conducted on geographies consisting of 347,458,890 people shows a moderate negative correlation between the proportion of Immigrants from Russia and percentage of population with at least professional degree education in the United States with a correlation coefficient (R) of -0.416 and weighted average of 6.0%. Similarly, the statistical analysis conducted on geographies consisting of 236,073,386 people shows a mild negative correlation between the proportion of Immigrants from Nicaragua and percentage of population with at least professional degree education in the United States with a correlation coefficient (R) of -0.306 and weighted average of 3.7%, a difference of 62.0%.
Professional Degree Correlation Summary
| Measurement | Immigrants from Russia | Immigrants from Nicaragua |
| Minimum | 0.49% | 0.72% |
| Maximum | 9.1% | 7.2% |
| Range | 8.6% | 6.5% |
| Mean | 5.3% | 3.2% |
| Median | 5.6% | 3.2% |
| Interquartile 25% (IQ1) | 4.1% | 2.2% |
| Interquartile 75% (IQ3) | 6.3% | 4.1% |
| Interquartile Range (IQR) | 2.2% | 1.9% |
| Standard Deviation (Sample) | 2.1% | 1.4% |
| Standard Deviation (Population) | 2.1% | 1.4% |
Similar Demographics by Professional Degree
Demographics Similar to Immigrants from Russia by Professional Degree
In terms of professional degree, the demographic groups most similar to Immigrants from Russia are Immigrants from Austria (6.0%, a difference of 0.32%), Immigrants from Norway (6.0%, a difference of 0.51%), Immigrants from South Africa (6.0%, a difference of 0.77%), Immigrants from Korea (6.1%, a difference of 0.90%), and Cambodian (6.0%, a difference of 1.2%).
| Demographics | Rating | Rank | Professional Degree |
| Immigrants | Sri Lanka | 100.0 /100 | #29 | Exceptional 6.2% |
| Immigrants | Turkey | 100.0 /100 | #30 | Exceptional 6.2% |
| Immigrants | India | 100.0 /100 | #31 | Exceptional 6.2% |
| Thais | 100.0 /100 | #32 | Exceptional 6.1% |
| Burmese | 100.0 /100 | #33 | Exceptional 6.1% |
| Mongolians | 100.0 /100 | #34 | Exceptional 6.1% |
| Immigrants | Korea | 100.0 /100 | #35 | Exceptional 6.1% |
| Immigrants | Russia | 100.0 /100 | #36 | Exceptional 6.0% |
| Immigrants | Austria | 100.0 /100 | #37 | Exceptional 6.0% |
| Immigrants | Norway | 100.0 /100 | #38 | Exceptional 6.0% |
| Immigrants | South Africa | 100.0 /100 | #39 | Exceptional 6.0% |
| Cambodians | 100.0 /100 | #40 | Exceptional 6.0% |
| New Zealanders | 100.0 /100 | #41 | Exceptional 6.0% |
| Estonians | 100.0 /100 | #42 | Exceptional 6.0% |
| Immigrants | Saudi Arabia | 100.0 /100 | #43 | Exceptional 5.9% |
Demographics Similar to Immigrants from Nicaragua by Professional Degree
In terms of professional degree, the demographic groups most similar to Immigrants from Nicaragua are Jamaican (3.7%, a difference of 0.14%), Pueblo (3.7%, a difference of 0.24%), Immigrants from Fiji (3.7%, a difference of 0.25%), Immigrants from Grenada (3.7%, a difference of 0.31%), and Tongan (3.7%, a difference of 0.39%).
| Demographics | Rating | Rank | Professional Degree |
| Immigrants | Bahamas | 2.0 /100 | #244 | Tragic 3.8% |
| French American Indians | 1.7 /100 | #245 | Tragic 3.8% |
| Marshallese | 1.7 /100 | #246 | Tragic 3.8% |
| Guyanese | 1.6 /100 | #247 | Tragic 3.8% |
| Hmong | 1.6 /100 | #248 | Tragic 3.7% |
| Immigrants | Grenada | 1.5 /100 | #249 | Tragic 3.7% |
| Immigrants | Fiji | 1.5 /100 | #250 | Tragic 3.7% |
| Immigrants | Nicaragua | 1.4 /100 | #251 | Tragic 3.7% |
| Jamaicans | 1.4 /100 | #252 | Tragic 3.7% |
| Pueblo | 1.4 /100 | #253 | Tragic 3.7% |
| Tongans | 1.3 /100 | #254 | Tragic 3.7% |
| Osage | 1.2 /100 | #255 | Tragic 3.7% |
| Iroquois | 1.2 /100 | #256 | Tragic 3.7% |
| Bahamians | 1.1 /100 | #257 | Tragic 3.7% |
| Immigrants | St. Vincent and the Grenadines | 1.1 /100 | #258 | Tragic 3.7% |