Portuguese vs Puget Sound Salish 8th Grade
COMPARE
Portuguese
Puget Sound Salish
8th Grade
8th Grade Comparison
Portuguese
Puget Sound Salish
95.5%
8TH GRADE
14.3/ 100
METRIC RATING
208th/ 347
METRIC RANK
96.5%
8TH GRADE
99.3/ 100
METRIC RATING
79th/ 347
METRIC RANK
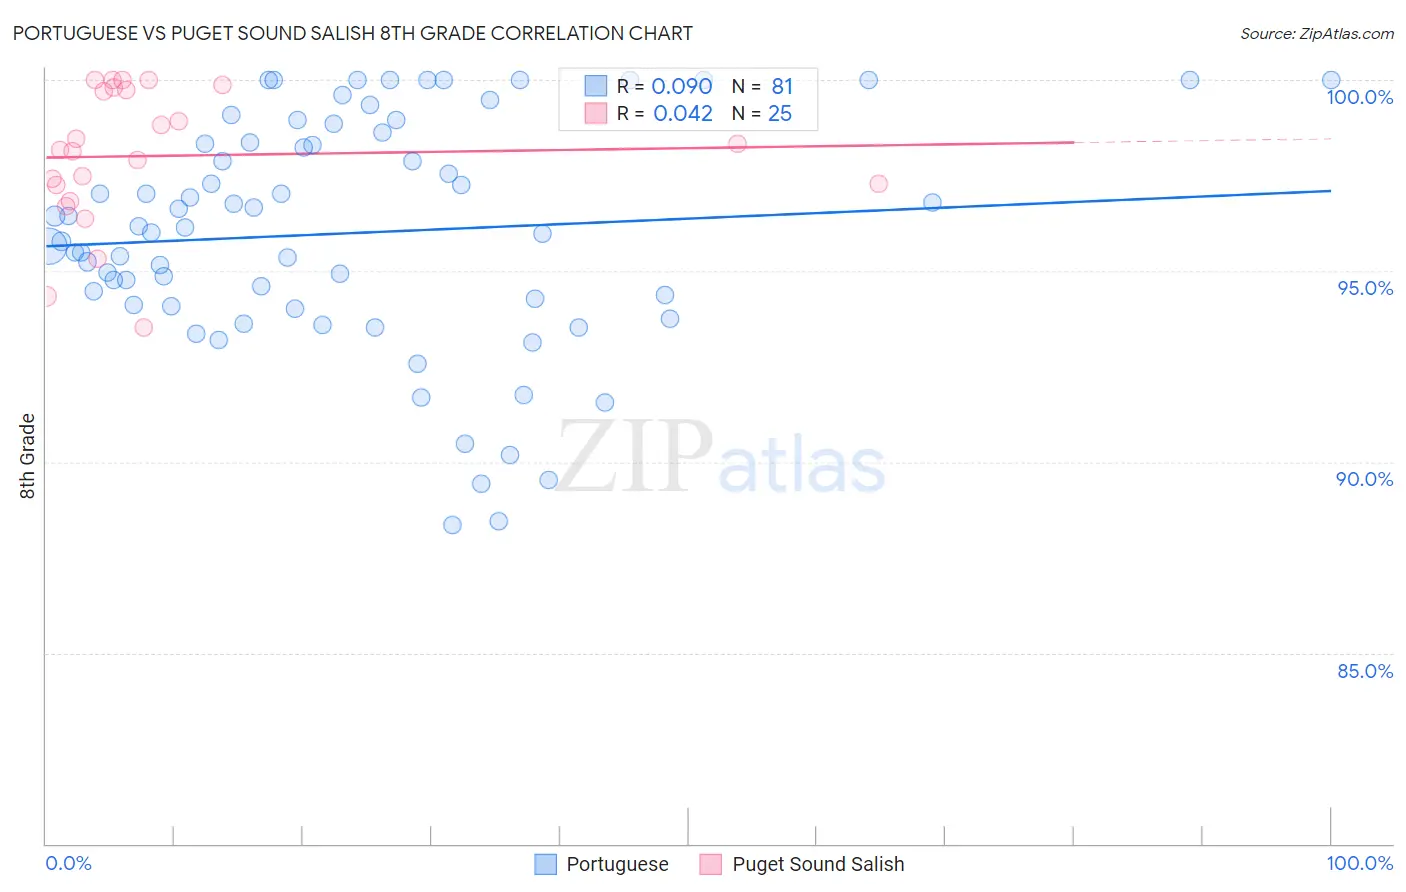
Portuguese vs Puget Sound Salish 8th Grade Correlation Chart
The statistical analysis conducted on geographies consisting of 450,343,001 people shows a slight positive correlation between the proportion of Portuguese and percentage of population with at least 8th grade education in the United States with a correlation coefficient (R) of 0.090 and weighted average of 95.5%. Similarly, the statistical analysis conducted on geographies consisting of 46,155,775 people shows no correlation between the proportion of Puget Sound Salish and percentage of population with at least 8th grade education in the United States with a correlation coefficient (R) of 0.042 and weighted average of 96.5%, a difference of 1.1%.
8th Grade Correlation Summary
| Measurement | Portuguese | Puget Sound Salish |
| Minimum | 88.3% | 93.5% |
| Maximum | 100.0% | 100.0% |
| Range | 11.7% | 6.5% |
| Mean | 96.0% | 98.0% |
| Median | 96.1% | 98.2% |
| Interquartile 25% (IQ1) | 94.1% | 97.0% |
| Interquartile 75% (IQ3) | 98.5% | 99.8% |
| Interquartile Range (IQR) | 4.4% | 2.7% |
| Standard Deviation (Sample) | 3.0% | 1.8% |
| Standard Deviation (Population) | 3.0% | 1.8% |
Similar Demographics by 8th Grade
Demographics Similar to Portuguese by 8th Grade
In terms of 8th grade, the demographic groups most similar to Portuguese are Immigrants from Sudan (95.5%, a difference of 0.010%), Immigrants from Lebanon (95.4%, a difference of 0.010%), African (95.4%, a difference of 0.010%), Hawaiian (95.5%, a difference of 0.030%), and Immigrants from Bahamas (95.5%, a difference of 0.030%).
| Demographics | Rating | Rank | 8th Grade |
| Immigrants | Argentina | 20.6 /100 | #201 | Fair 95.5% |
| Apache | 19.4 /100 | #202 | Poor 95.5% |
| Moroccans | 17.4 /100 | #203 | Poor 95.5% |
| Hawaiians | 16.7 /100 | #204 | Poor 95.5% |
| Immigrants | Bahamas | 16.7 /100 | #205 | Poor 95.5% |
| Comanche | 16.3 /100 | #206 | Poor 95.5% |
| Immigrants | Sudan | 15.1 /100 | #207 | Poor 95.5% |
| Portuguese | 14.3 /100 | #208 | Poor 95.5% |
| Immigrants | Lebanon | 13.7 /100 | #209 | Poor 95.4% |
| Africans | 13.6 /100 | #210 | Poor 95.4% |
| Immigrants | Morocco | 12.4 /100 | #211 | Poor 95.4% |
| Immigrants | Pakistan | 9.7 /100 | #212 | Tragic 95.4% |
| Laotians | 9.0 /100 | #213 | Tragic 95.4% |
| Immigrants | Chile | 9.0 /100 | #214 | Tragic 95.4% |
| Immigrants | Liberia | 8.9 /100 | #215 | Tragic 95.4% |
Demographics Similar to Puget Sound Salish by 8th Grade
In terms of 8th grade, the demographic groups most similar to Puget Sound Salish are Cypriot (96.5%, a difference of 0.020%), Yugoslavian (96.5%, a difference of 0.020%), Delaware (96.5%, a difference of 0.020%), Romanian (96.5%, a difference of 0.020%), and Turkish (96.5%, a difference of 0.020%).
| Demographics | Rating | Rank | 8th Grade |
| Immigrants | England | 99.5 /100 | #72 | Exceptional 96.6% |
| Arapaho | 99.5 /100 | #73 | Exceptional 96.6% |
| Immigrants | Ireland | 99.5 /100 | #74 | Exceptional 96.5% |
| Zimbabweans | 99.4 /100 | #75 | Exceptional 96.5% |
| Immigrants | Netherlands | 99.4 /100 | #76 | Exceptional 96.5% |
| Cypriots | 99.4 /100 | #77 | Exceptional 96.5% |
| Yugoslavians | 99.4 /100 | #78 | Exceptional 96.5% |
| Puget Sound Salish | 99.3 /100 | #79 | Exceptional 96.5% |
| Delaware | 99.2 /100 | #80 | Exceptional 96.5% |
| Romanians | 99.2 /100 | #81 | Exceptional 96.5% |
| Turks | 99.2 /100 | #82 | Exceptional 96.5% |
| Icelanders | 99.2 /100 | #83 | Exceptional 96.5% |
| Immigrants | Belgium | 99.1 /100 | #84 | Exceptional 96.5% |
| Immigrants | South Africa | 99.1 /100 | #85 | Exceptional 96.5% |
| Cherokee | 99.0 /100 | #86 | Exceptional 96.5% |