Cypriot vs Immigrants from Uganda 7th Grade
COMPARE
Cypriot
Immigrants from Uganda
7th Grade
7th Grade Comparison
Cypriots
Immigrants from Uganda
96.8%
7TH GRADE
99.3/ 100
METRIC RATING
79th/ 347
METRIC RANK
96.0%
7TH GRADE
36.0/ 100
METRIC RATING
187th/ 347
METRIC RANK
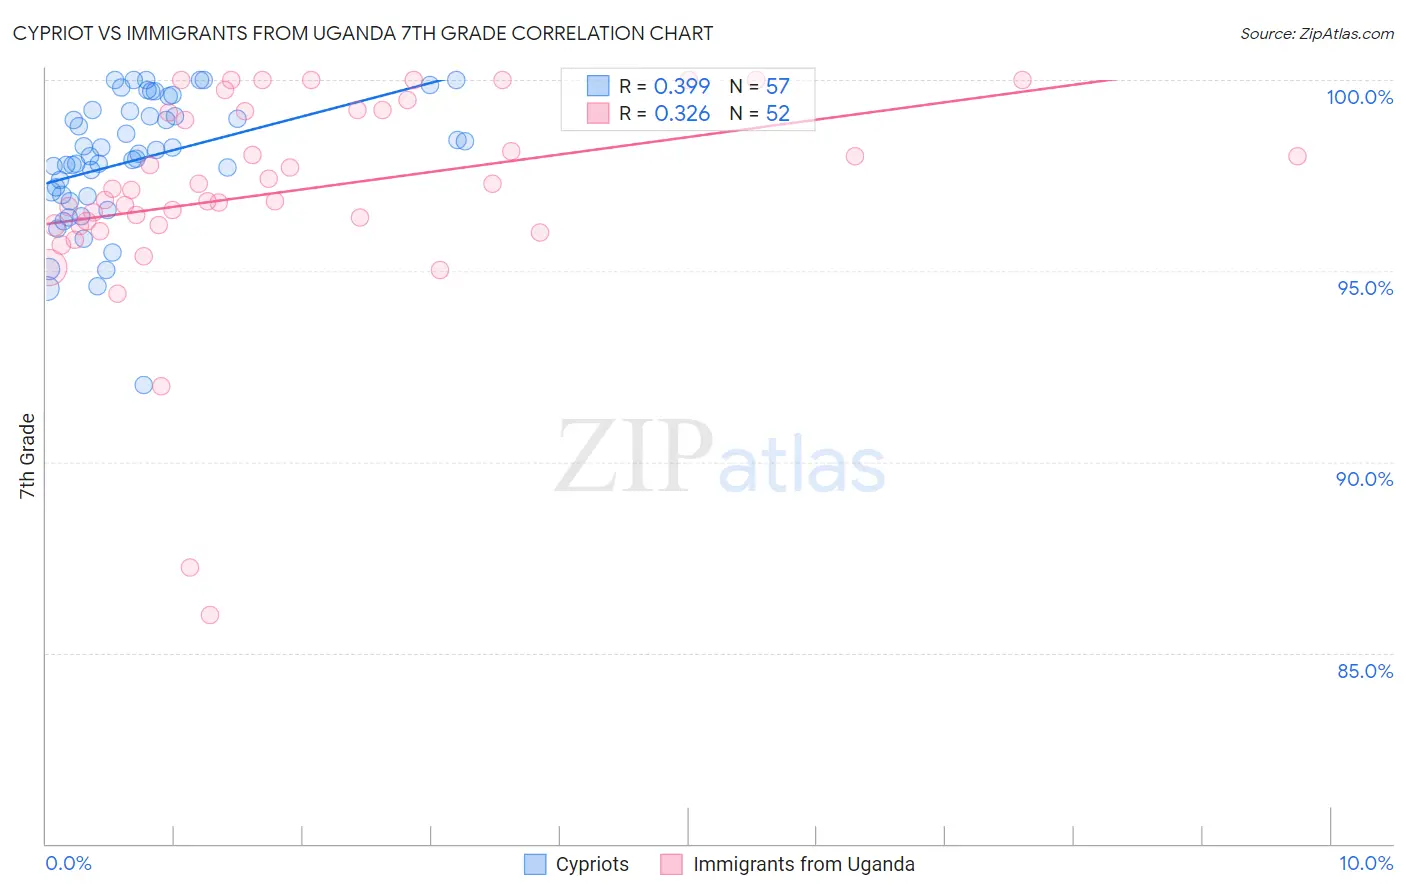
Cypriot vs Immigrants from Uganda 7th Grade Correlation Chart
The statistical analysis conducted on geographies consisting of 61,870,289 people shows a mild positive correlation between the proportion of Cypriots and percentage of population with at least 7th grade education in the United States with a correlation coefficient (R) of 0.399 and weighted average of 96.8%. Similarly, the statistical analysis conducted on geographies consisting of 125,943,496 people shows a mild positive correlation between the proportion of Immigrants from Uganda and percentage of population with at least 7th grade education in the United States with a correlation coefficient (R) of 0.326 and weighted average of 96.0%, a difference of 0.85%.
7th Grade Correlation Summary
| Measurement | Cypriot | Immigrants from Uganda |
| Minimum | 92.0% | 86.0% |
| Maximum | 100.0% | 100.0% |
| Range | 8.0% | 14.0% |
| Mean | 97.9% | 97.1% |
| Median | 98.1% | 97.1% |
| Interquartile 25% (IQ1) | 97.0% | 96.2% |
| Interquartile 75% (IQ3) | 99.2% | 99.2% |
| Interquartile Range (IQR) | 2.2% | 3.0% |
| Standard Deviation (Sample) | 1.7% | 2.8% |
| Standard Deviation (Population) | 1.7% | 2.7% |
Similar Demographics by 7th Grade
Demographics Similar to Cypriots by 7th Grade
In terms of 7th grade, the demographic groups most similar to Cypriots are Immigrants from Netherlands (96.8%, a difference of 0.0%), Yugoslavian (96.8%, a difference of 0.0%), Immigrants from Ireland (96.8%, a difference of 0.010%), Cherokee (96.8%, a difference of 0.010%), and Delaware (96.8%, a difference of 0.020%).
| Demographics | Rating | Rank | 7th Grade |
| Cajuns | 99.5 /100 | #72 | Exceptional 96.8% |
| Arapaho | 99.5 /100 | #73 | Exceptional 96.8% |
| Immigrants | England | 99.5 /100 | #74 | Exceptional 96.8% |
| Zimbabweans | 99.5 /100 | #75 | Exceptional 96.8% |
| Immigrants | Ireland | 99.4 /100 | #76 | Exceptional 96.8% |
| Cherokee | 99.4 /100 | #77 | Exceptional 96.8% |
| Immigrants | Netherlands | 99.3 /100 | #78 | Exceptional 96.8% |
| Cypriots | 99.3 /100 | #79 | Exceptional 96.8% |
| Yugoslavians | 99.3 /100 | #80 | Exceptional 96.8% |
| Delaware | 99.2 /100 | #81 | Exceptional 96.8% |
| Chickasaw | 99.2 /100 | #82 | Exceptional 96.7% |
| Icelanders | 99.1 /100 | #83 | Exceptional 96.7% |
| Romanians | 99.1 /100 | #84 | Exceptional 96.7% |
| Kiowa | 99.1 /100 | #85 | Exceptional 96.7% |
| Turks | 99.1 /100 | #86 | Exceptional 96.7% |
Demographics Similar to Immigrants from Uganda by 7th Grade
In terms of 7th grade, the demographic groups most similar to Immigrants from Uganda are Immigrants from Iraq (96.0%, a difference of 0.0%), Sierra Leonean (96.0%, a difference of 0.010%), Brazilian (96.0%, a difference of 0.010%), Immigrants from Egypt (95.9%, a difference of 0.010%), and Immigrants from Venezuela (95.9%, a difference of 0.010%).
| Demographics | Rating | Rank | 7th Grade |
| Immigrants | Brazil | 46.8 /100 | #180 | Average 96.0% |
| Pakistanis | 44.5 /100 | #181 | Average 96.0% |
| Iraqis | 41.2 /100 | #182 | Average 96.0% |
| Immigrants | Spain | 38.8 /100 | #183 | Fair 96.0% |
| Sierra Leoneans | 37.5 /100 | #184 | Fair 96.0% |
| Brazilians | 37.3 /100 | #185 | Fair 96.0% |
| Immigrants | Iraq | 36.1 /100 | #186 | Fair 96.0% |
| Immigrants | Uganda | 36.0 /100 | #187 | Fair 96.0% |
| Immigrants | Egypt | 34.3 /100 | #188 | Fair 95.9% |
| Immigrants | Venezuela | 33.9 /100 | #189 | Fair 95.9% |
| Immigrants | Micronesia | 32.6 /100 | #190 | Fair 95.9% |
| Liberians | 32.5 /100 | #191 | Fair 95.9% |
| Panamanians | 32.3 /100 | #192 | Fair 95.9% |
| Immigrants | Bahamas | 30.8 /100 | #193 | Fair 95.9% |
| Immigrants | Nepal | 30.0 /100 | #194 | Fair 95.9% |