Houma vs Immigrants from Grenada 7th Grade
COMPARE
Houma
Immigrants from Grenada
7th Grade
7th Grade Comparison
Houma
Immigrants from Grenada
95.1%
7TH GRADE
0.2/ 100
METRIC RATING
270th/ 347
METRIC RANK
94.8%
7TH GRADE
0.0/ 100
METRIC RATING
291st/ 347
METRIC RANK
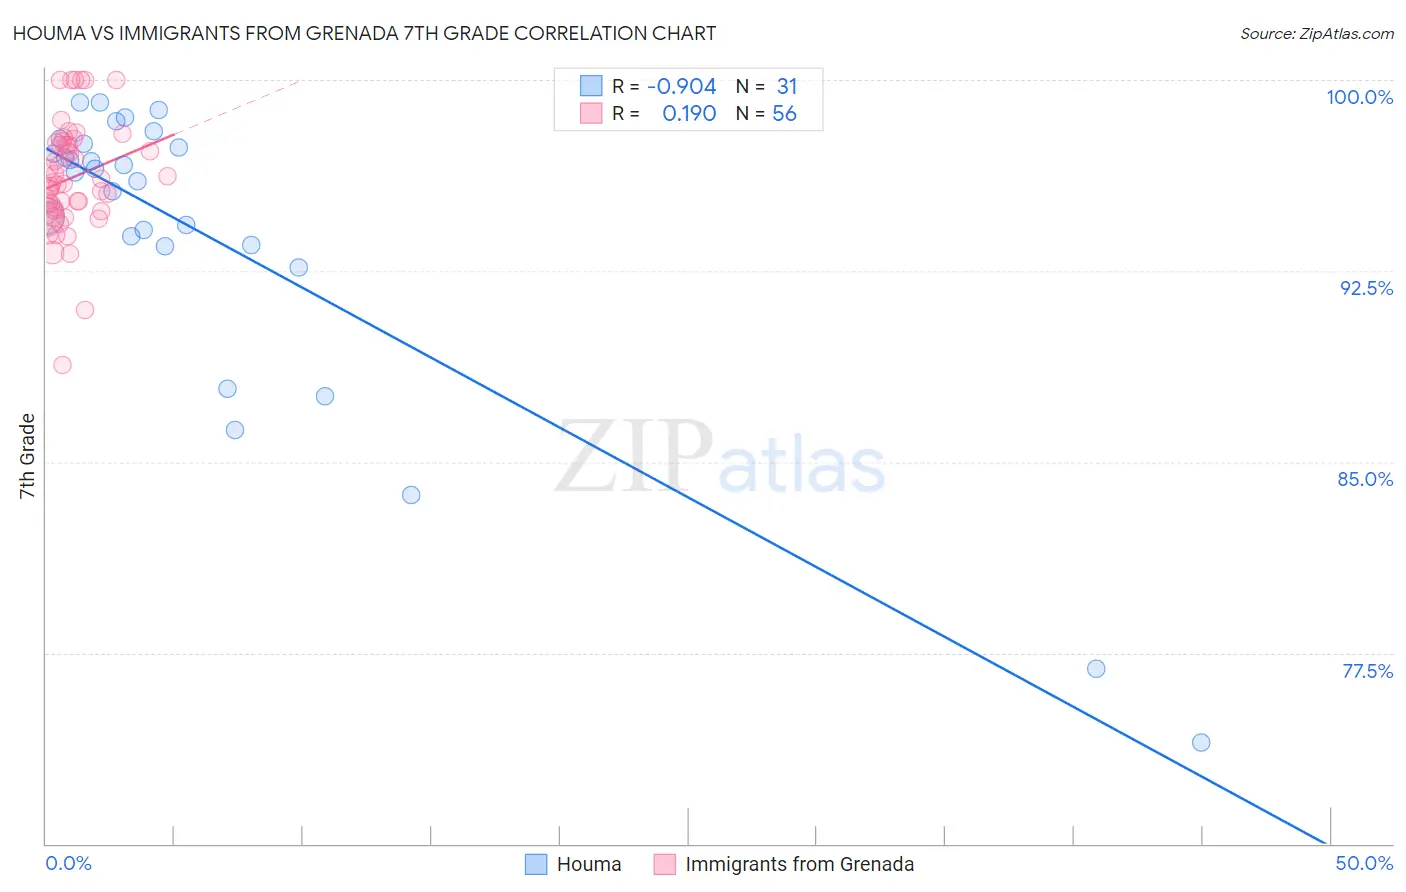
Houma vs Immigrants from Grenada 7th Grade Correlation Chart
The statistical analysis conducted on geographies consisting of 36,795,916 people shows a near-perfect negative correlation between the proportion of Houma and percentage of population with at least 7th grade education in the United States with a correlation coefficient (R) of -0.904 and weighted average of 95.1%. Similarly, the statistical analysis conducted on geographies consisting of 67,191,509 people shows a poor positive correlation between the proportion of Immigrants from Grenada and percentage of population with at least 7th grade education in the United States with a correlation coefficient (R) of 0.190 and weighted average of 94.8%, a difference of 0.38%.
7th Grade Correlation Summary
| Measurement | Houma | Immigrants from Grenada |
| Minimum | 74.0% | 88.8% |
| Maximum | 99.1% | 100.0% |
| Range | 25.2% | 11.2% |
| Mean | 93.8% | 96.2% |
| Median | 96.4% | 95.9% |
| Interquartile 25% (IQ1) | 93.5% | 94.9% |
| Interquartile 75% (IQ3) | 97.5% | 97.5% |
| Interquartile Range (IQR) | 4.0% | 2.6% |
| Standard Deviation (Sample) | 6.2% | 2.2% |
| Standard Deviation (Population) | 6.1% | 2.2% |
Similar Demographics by 7th Grade
Demographics Similar to Houma by 7th Grade
In terms of 7th grade, the demographic groups most similar to Houma are Immigrants from South America (95.1%, a difference of 0.0%), Peruvian (95.1%, a difference of 0.0%), Immigrants from Uzbekistan (95.1%, a difference of 0.010%), Immigrants from Western Africa (95.1%, a difference of 0.010%), and Trinidadian and Tobagonian (95.2%, a difference of 0.020%).
| Demographics | Rating | Rank | 7th Grade |
| West Indians | 0.5 /100 | #263 | Tragic 95.2% |
| Immigrants | Nigeria | 0.4 /100 | #264 | Tragic 95.2% |
| Immigrants | Uruguay | 0.3 /100 | #265 | Tragic 95.2% |
| Immigrants | Ghana | 0.3 /100 | #266 | Tragic 95.2% |
| Yuman | 0.3 /100 | #267 | Tragic 95.2% |
| Immigrants | Hong Kong | 0.3 /100 | #268 | Tragic 95.2% |
| Trinidadians and Tobagonians | 0.3 /100 | #269 | Tragic 95.2% |
| Houma | 0.2 /100 | #270 | Tragic 95.1% |
| Immigrants | South America | 0.2 /100 | #271 | Tragic 95.1% |
| Peruvians | 0.2 /100 | #272 | Tragic 95.1% |
| Immigrants | Uzbekistan | 0.2 /100 | #273 | Tragic 95.1% |
| Immigrants | Western Africa | 0.2 /100 | #274 | Tragic 95.1% |
| Immigrants | Colombia | 0.2 /100 | #275 | Tragic 95.1% |
| Immigrants | Thailand | 0.2 /100 | #276 | Tragic 95.1% |
| Immigrants | Afghanistan | 0.2 /100 | #277 | Tragic 95.1% |
Demographics Similar to Immigrants from Grenada by 7th Grade
In terms of 7th grade, the demographic groups most similar to Immigrants from Grenada are Immigrants from West Indies (94.8%, a difference of 0.020%), Malaysian (94.8%, a difference of 0.040%), Fijian (94.7%, a difference of 0.040%), Taiwanese (94.8%, a difference of 0.060%), and British West Indian (94.8%, a difference of 0.070%).
| Demographics | Rating | Rank | 7th Grade |
| Armenians | 0.1 /100 | #284 | Tragic 95.0% |
| Immigrants | Eritrea | 0.1 /100 | #285 | Tragic 94.9% |
| Immigrants | Philippines | 0.0 /100 | #286 | Tragic 94.9% |
| Immigrants | Peru | 0.0 /100 | #287 | Tragic 94.9% |
| British West Indians | 0.0 /100 | #288 | Tragic 94.8% |
| Taiwanese | 0.0 /100 | #289 | Tragic 94.8% |
| Malaysians | 0.0 /100 | #290 | Tragic 94.8% |
| Immigrants | Grenada | 0.0 /100 | #291 | Tragic 94.8% |
| Immigrants | West Indies | 0.0 /100 | #292 | Tragic 94.8% |
| Fijians | 0.0 /100 | #293 | Tragic 94.7% |
| Haitians | 0.0 /100 | #294 | Tragic 94.7% |
| Yaqui | 0.0 /100 | #295 | Tragic 94.6% |
| Cubans | 0.0 /100 | #296 | Tragic 94.6% |
| Immigrants | South Eastern Asia | 0.0 /100 | #297 | Tragic 94.5% |
| Indonesians | 0.0 /100 | #298 | Tragic 94.5% |